Context-Related Tools
Not all tools in the toolbar are static or always visible. There are tools that relate to a specific context, for example, to a layer that is currently selected in the TOC.
To select a layer in the TOC, simply click on it with the mouse. The selection is highlighted in color. Additionally, new tools that relate to this layer also appear, highlighted in color:
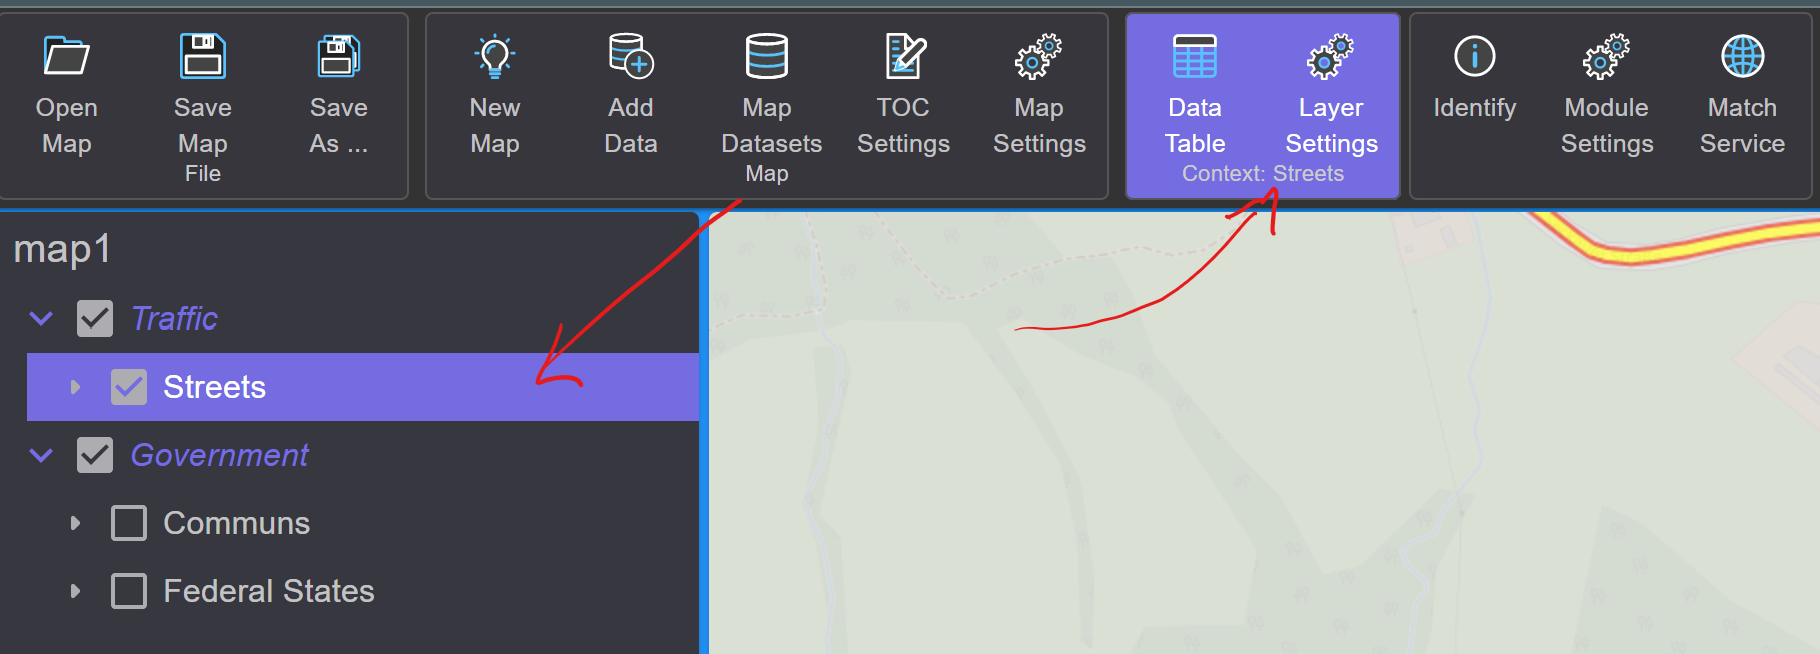
For example, the following tools are displayed for Feature Layers:
Data Table: Displays the data of the layer in a table format.
Layer Settings: Opens the dialog for the layer’s settings.
Note
In the color-highlighted toolbox, the text Context: ... indicates
which object (here Layer Streets) the tools relate to.
A group layer has some different context-related tools:
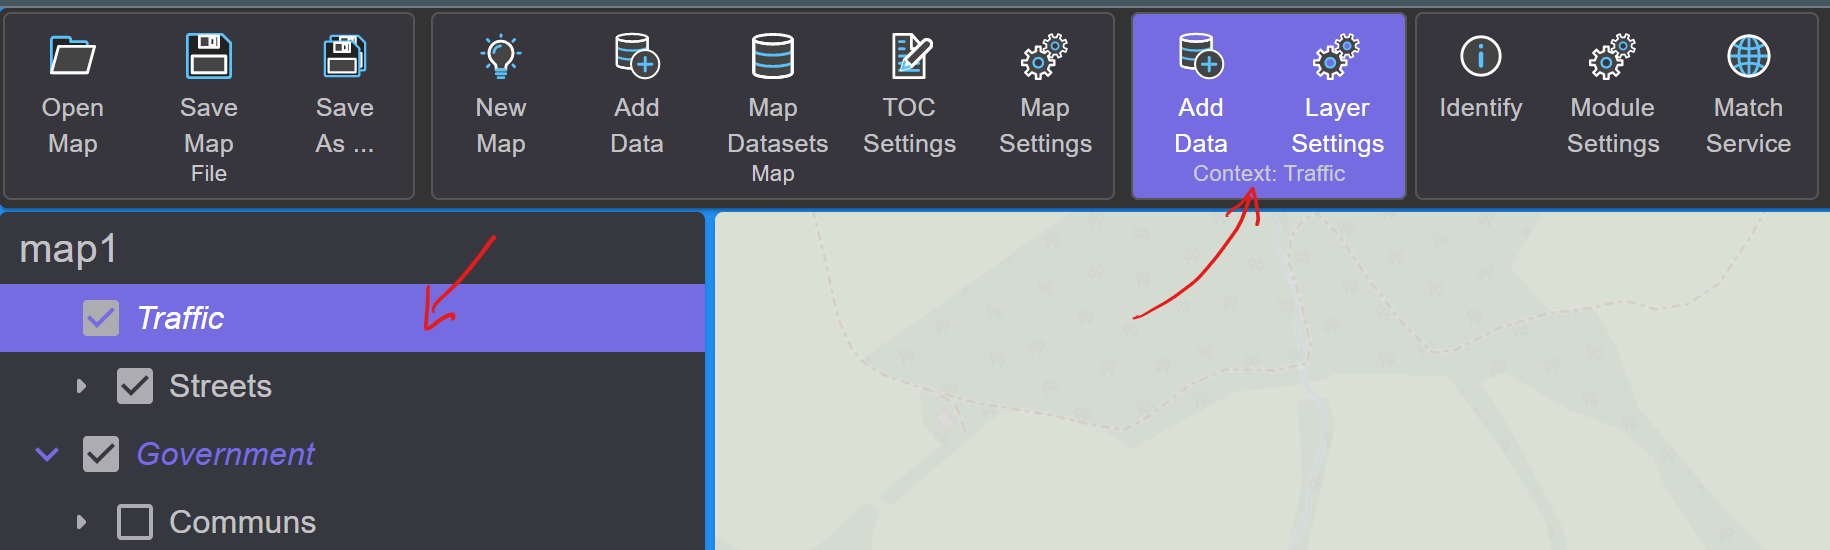
Add Data: Corresponds to
Add Datafrom theMapToolbox. However, layers added here are directly inserted into this group.Layer Settings: Group layers also have Settings. These can be managed here.