Representation and Symbology
Here, we describe how the display of individual layers can be customized. In our example, municipalities should appear orange and roads in yellow and red. The simplest way to change a symbol is to double-click on the corresponding legend symbol in the TOC. This opens a mask that displays the most important properties of the symbol:
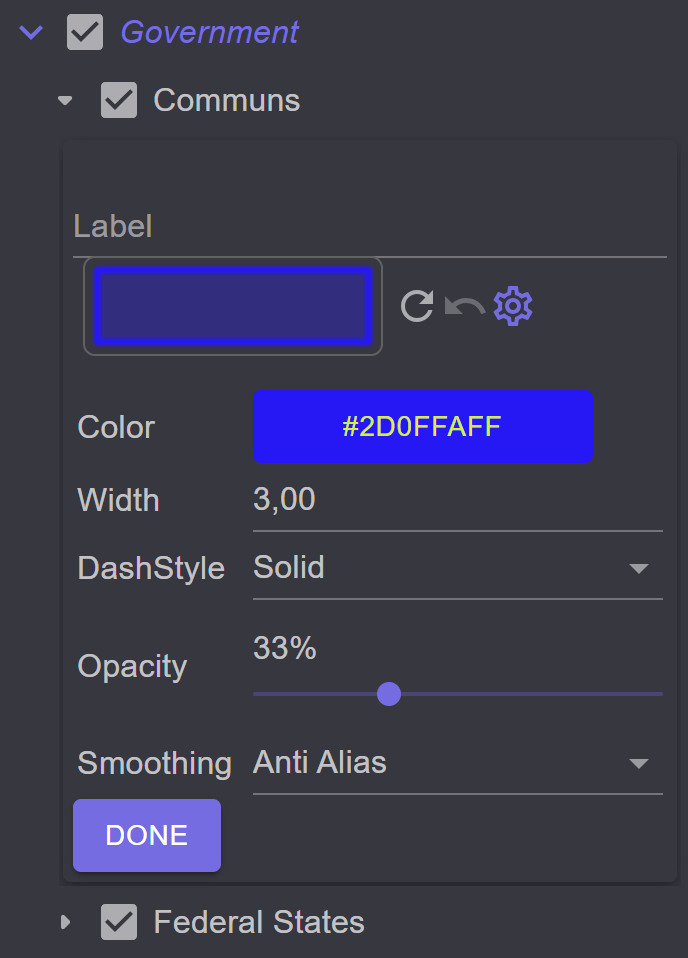
For areal symbols, these include:
Color: The color of the symbol (clicking on the rectangle opens the color palette)Width: The width of the lineDashstyle: The style of the line (solid, dashed, …)Opacity: The opacity of the areaSmoothing: The smoothing mode (None, Antialias)
In the upper area of the mask, a label can be assigned for the legend symbol. Below it is the Preview, which changes immediately when a property is altered. Next to it are three buttons with the following tooltips:
Create new random symbol: Creates a new random symbolUndo: Reverses theCreate new random symbolcommandSymbol Composer: The Symbol Composer allows for the creation of more complex symbols.The Symbol Composer can also be opened by clicking on the Preview.
To apply the changes, the mask can be closed with Done.
Symbol Composer
The Symbol Composer is similarly structured for all symbols.
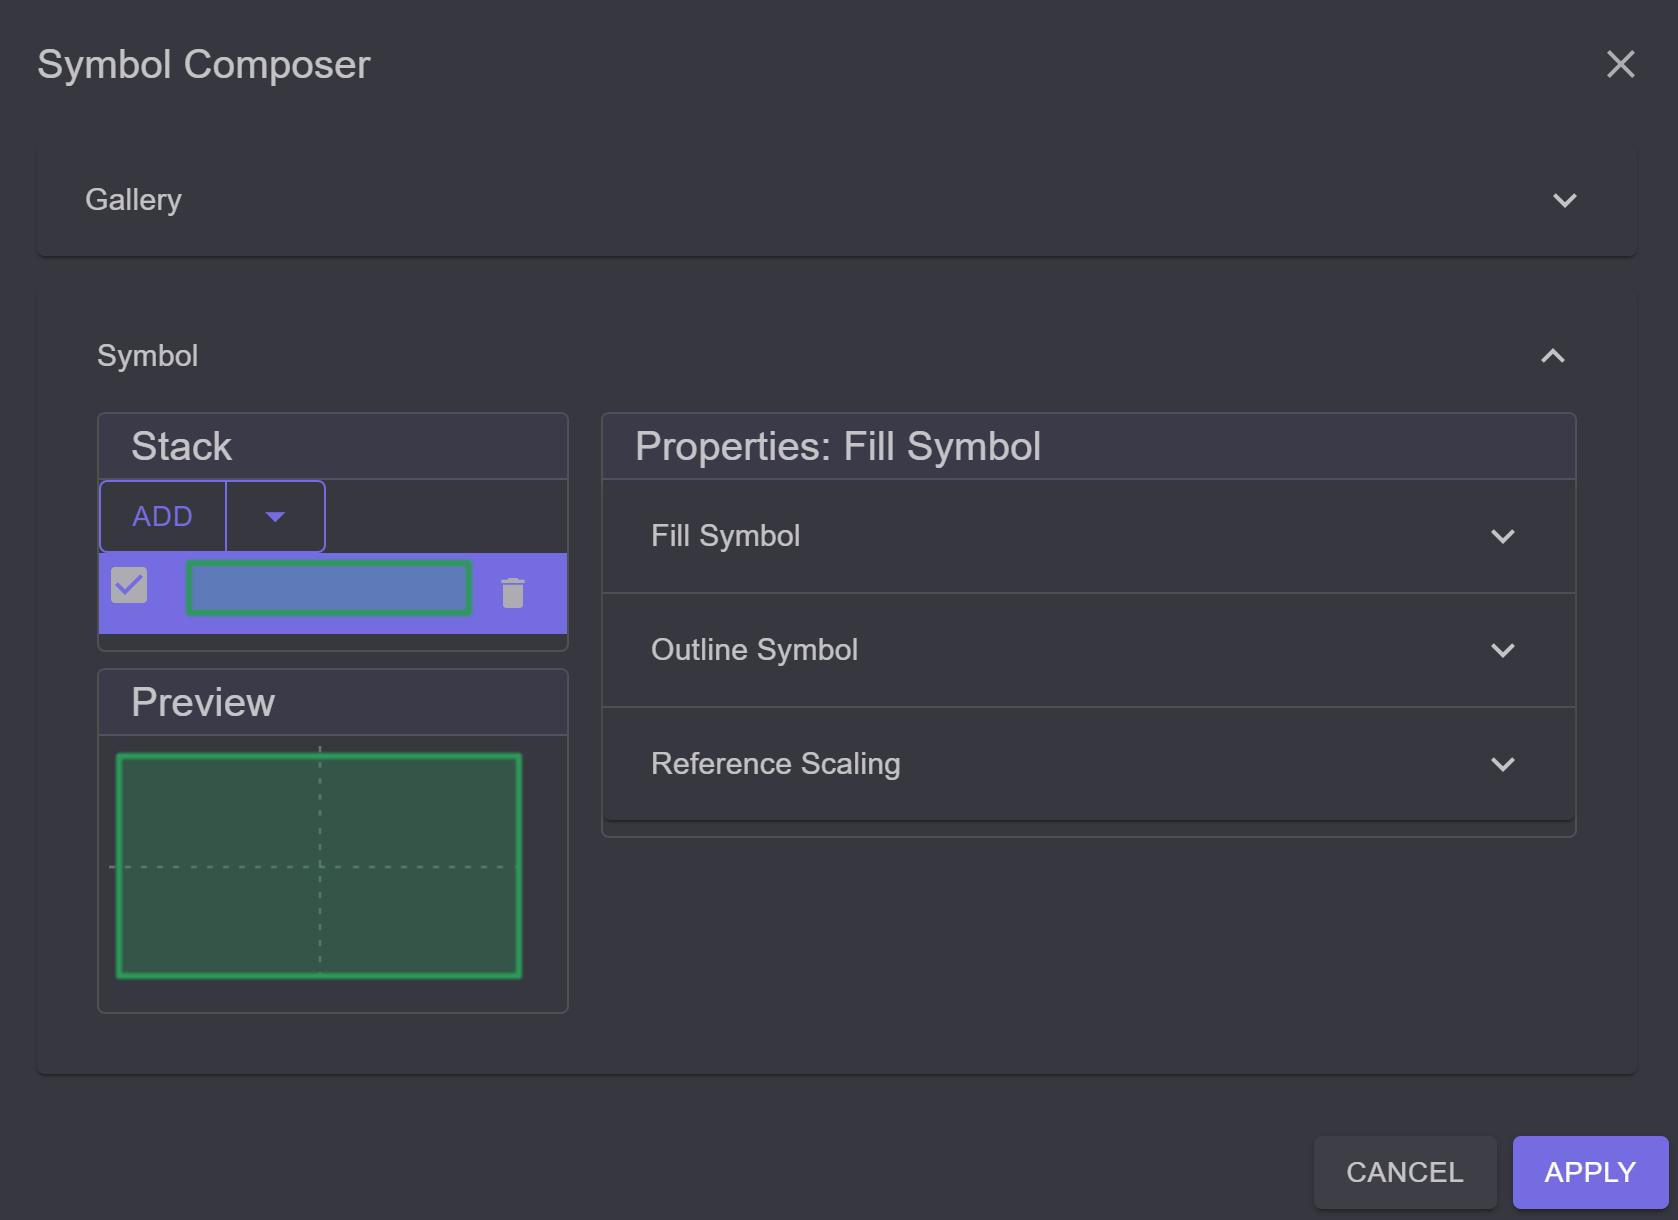
On the left, the symbol layers and the preview are displayed. On the right, attributes such as color, line thickness, etc., can be specified for a symbol. The attributes are usually thematically grouped. By clicking on a category, the attributes can be edited.
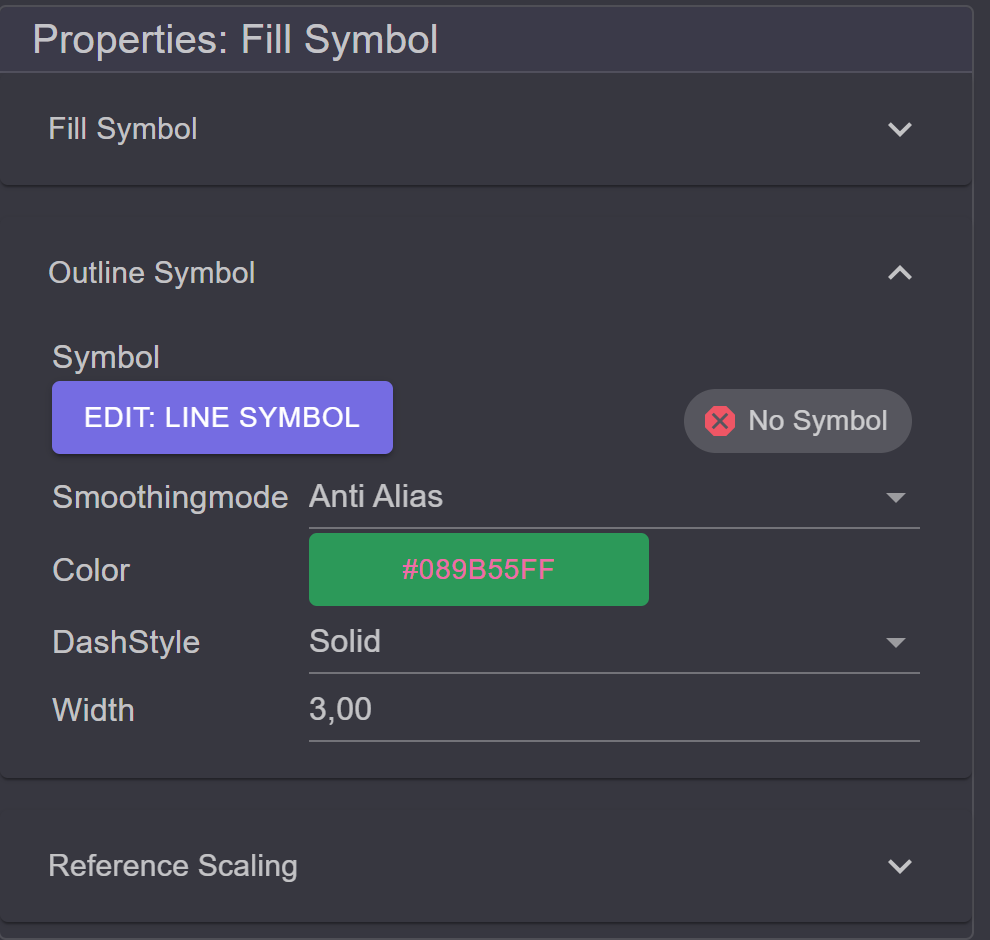
In the Outline Symbol category, the properties of the outline of the area can be defined.
Here, the most common attributes are displayed again:
Some attributes can be changed via input fields and selection lists, while others offer one
or more buttons:
For Color, clicking on the color opens the color palette.
The button Edit: Line Symbol opens the Symbol Composer for
the outline. If no outline is desired, the line symbol can be removed with
No Symbol.
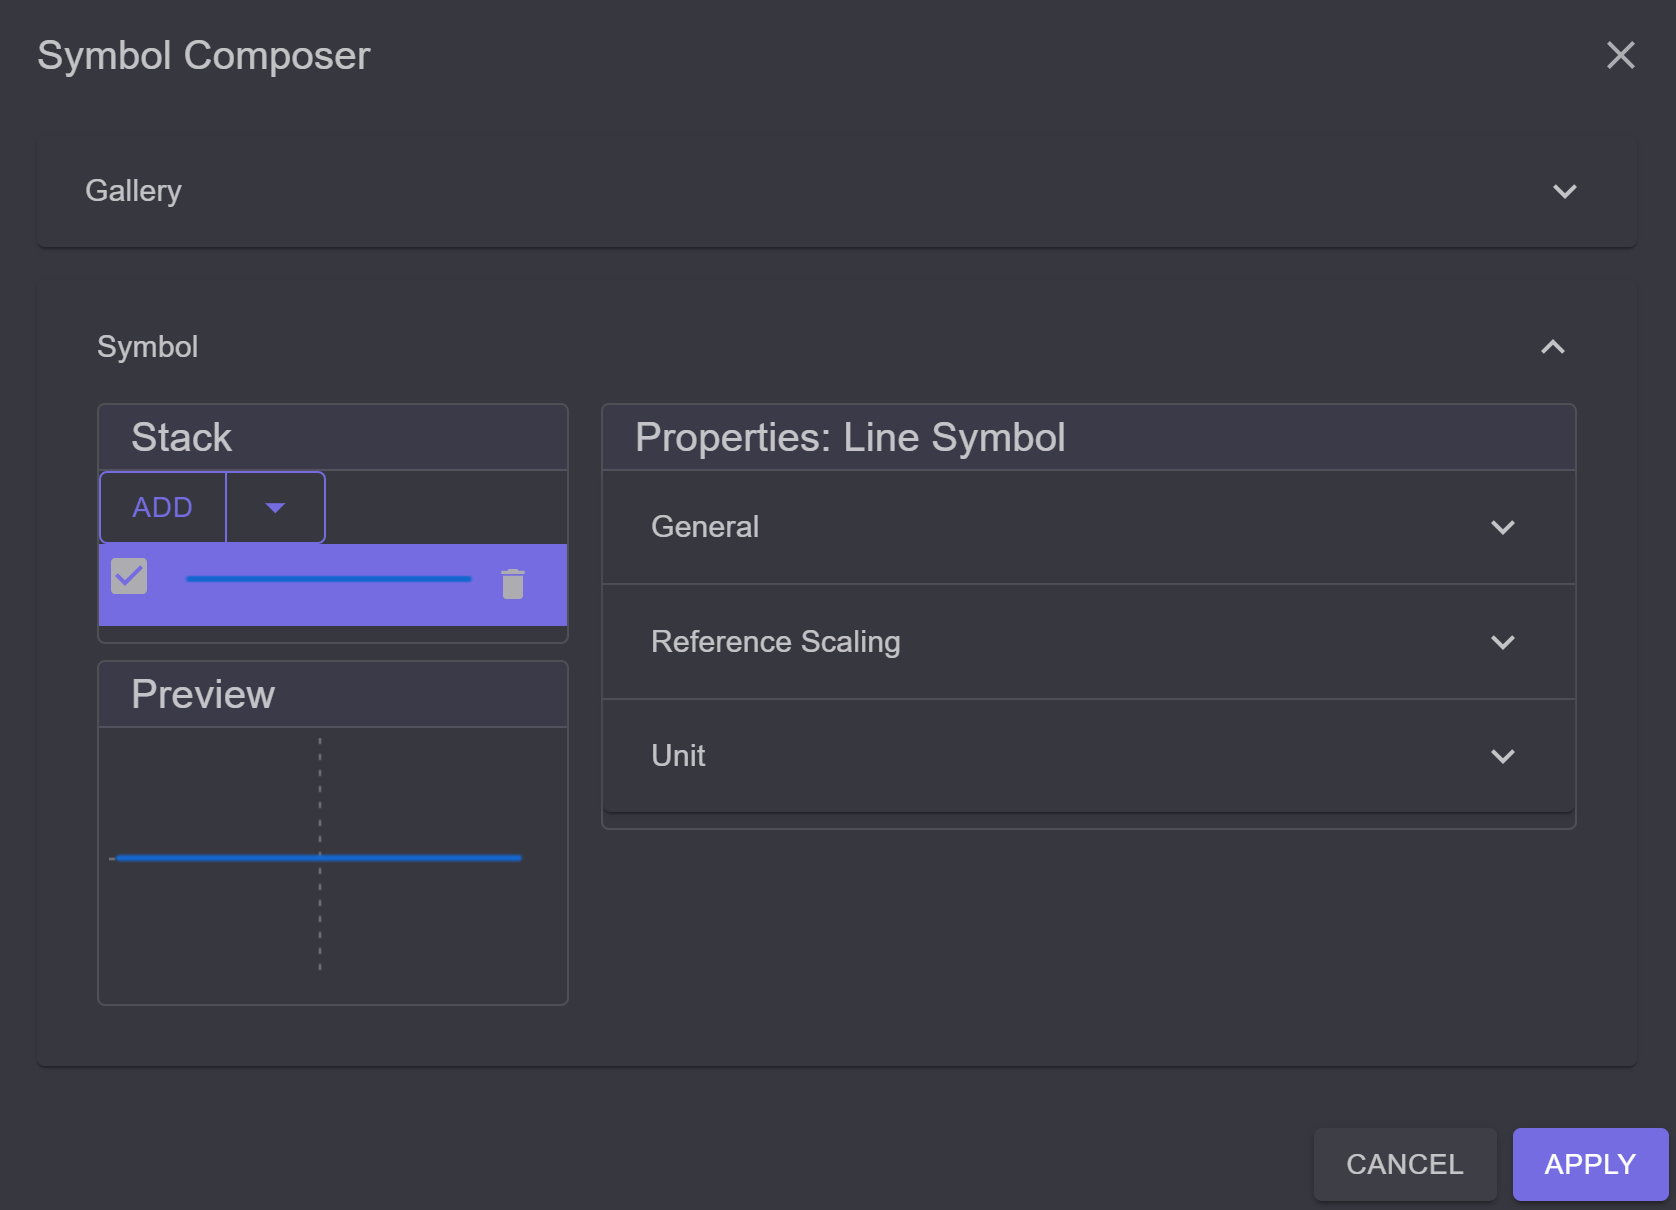
In the upper area of the Symbol Composer, there is the Gallery. Opening the
gallery with a click displays predefined symbols for the current geometry type:
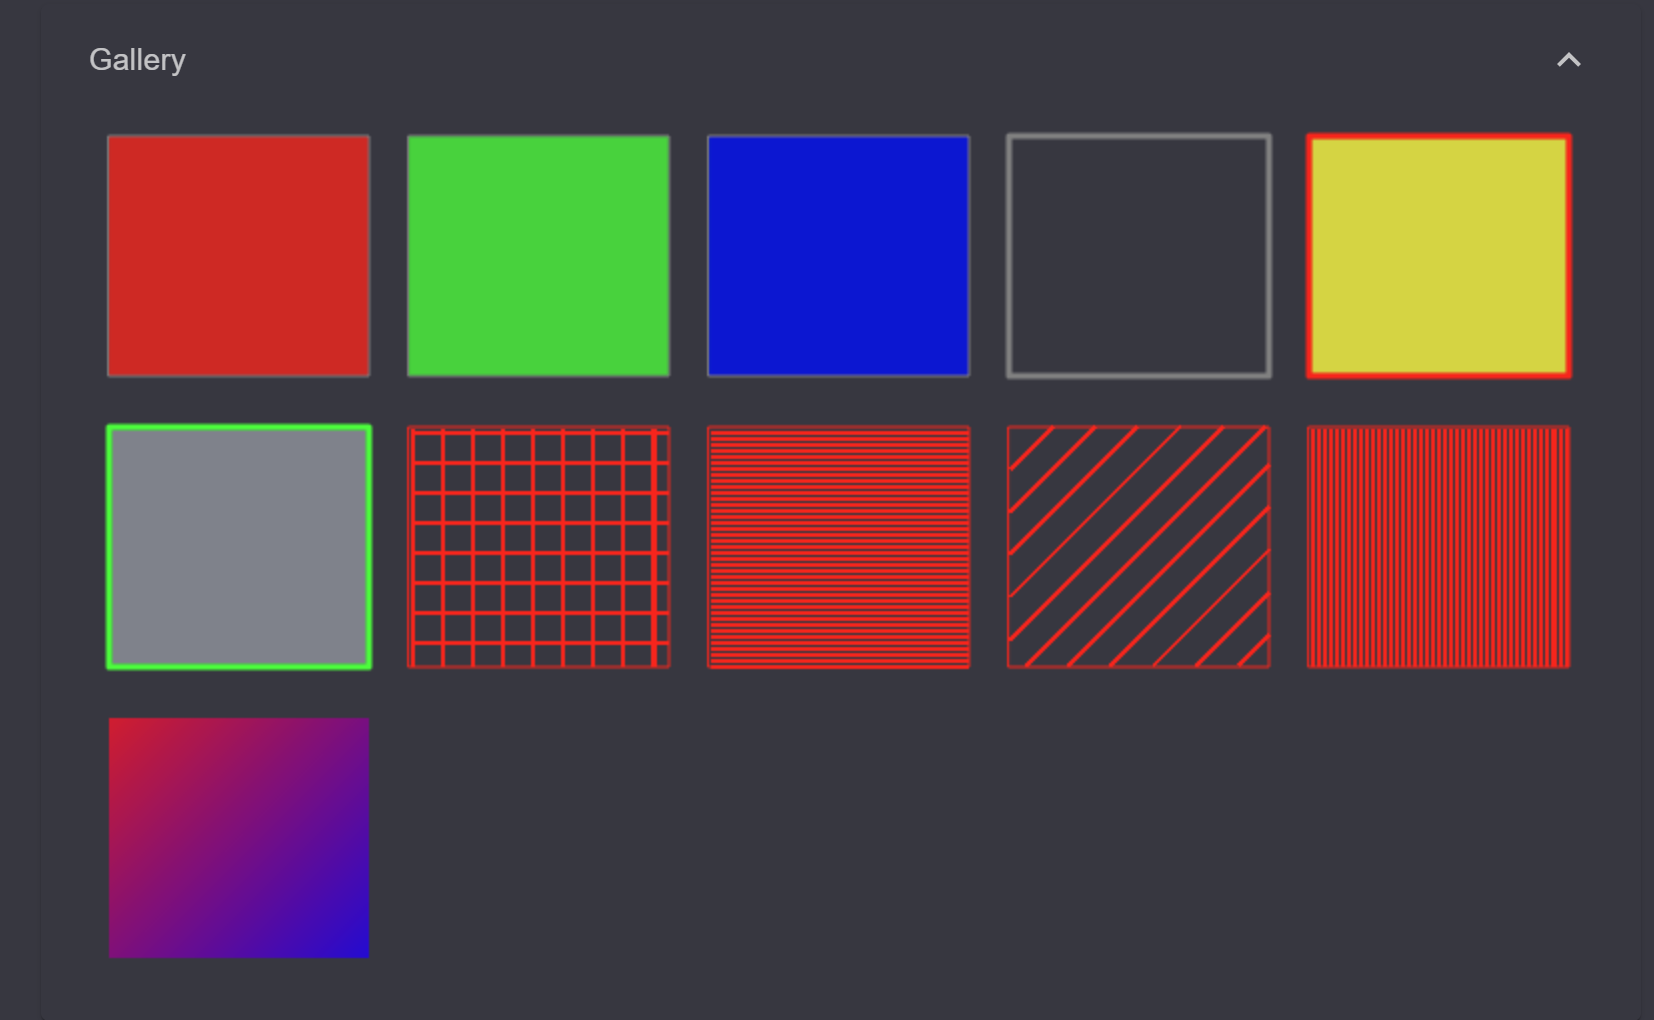
When you click on a tile, it is adopted as a new symbol. If you want to add the displayed
symbol to a stack of symbols, you must click on the + symbol that appears
when you hover the mouse over the tile.
Before we describe the Symbol Stack, let’s change the color of the
area to orange and close the dialog with Apply.
If the Symbol Composer was opened via the TOC, the symbol mask in the TOC must then be
confirmed with Done. After that, the map is redrawn with the changed symbol.
The same procedure can be followed for the line symbol for the Streets layer to open the Symbol Composer:
The goal is to create a yellow line with a red border as the symbol. The simplest way is to
open the Gallery and select a symbol. For understanding, let’s create the symbol without
using this shortcut.
A line symbol can only ever display one color. There are no standard symbols for lined borders. The idea here is to draw multiple layers of symbols. First, a red line should be drawn, matching the width of the symbol. Then, a thinner yellow line can be drawn over it in the second step.
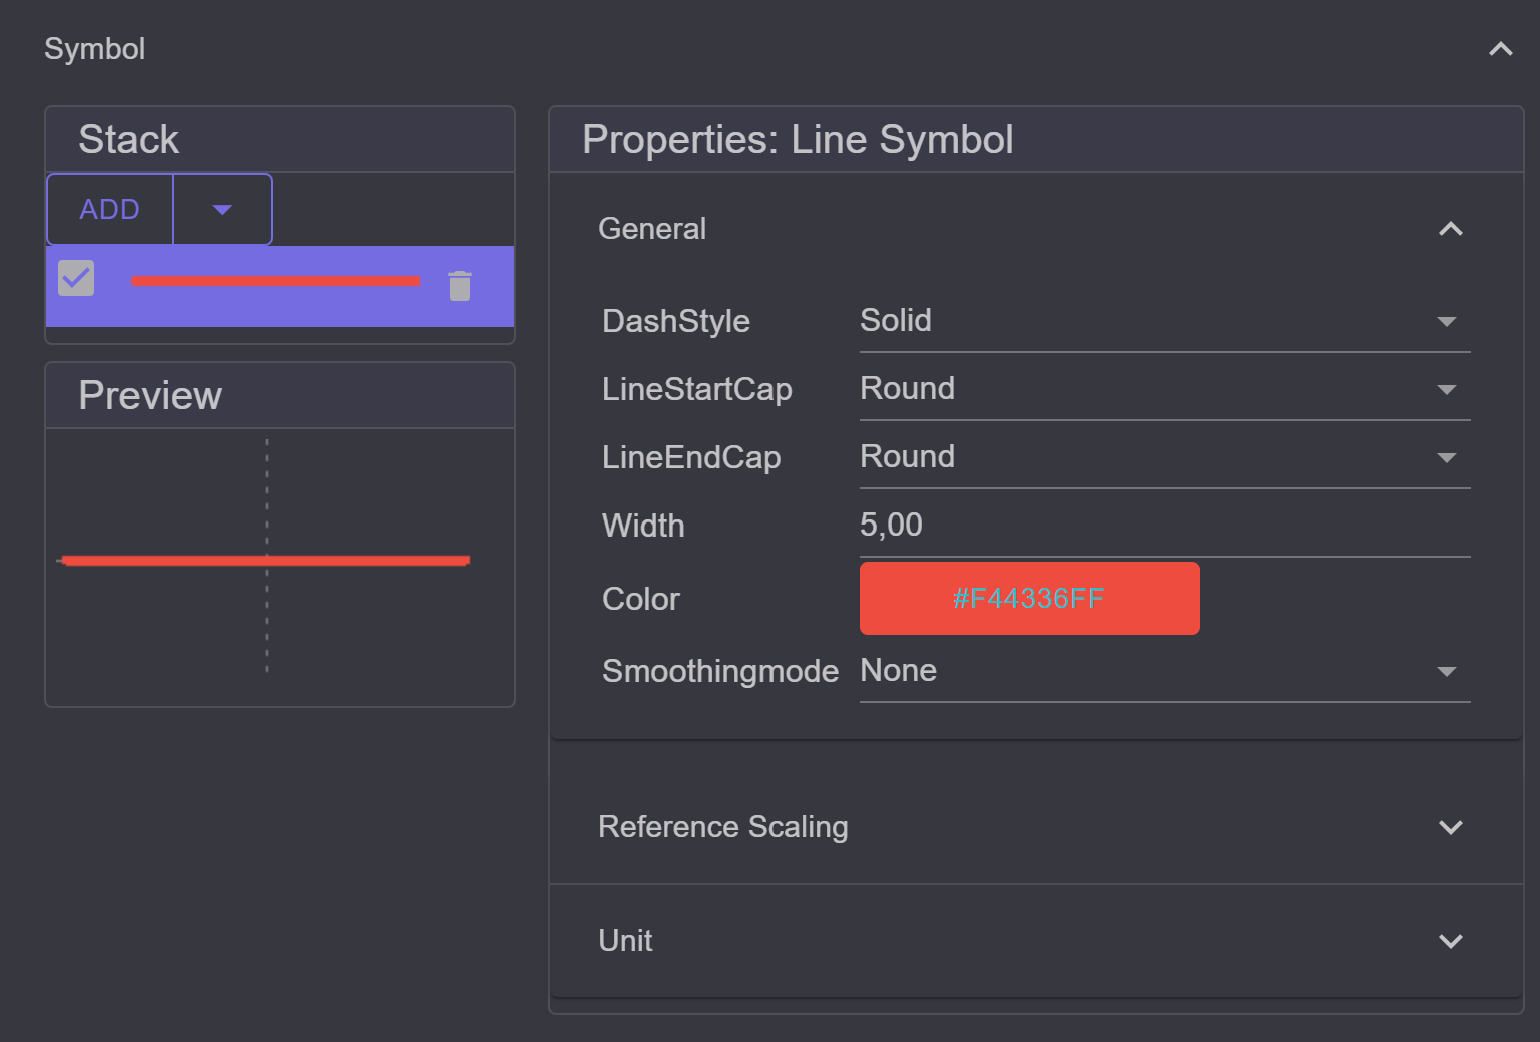
This can be done using the Symbol Stack in the Symbol Composer. Currently, there is one
layer. Through the setting in General (right), the color can be set to red and the line thickness to
5.
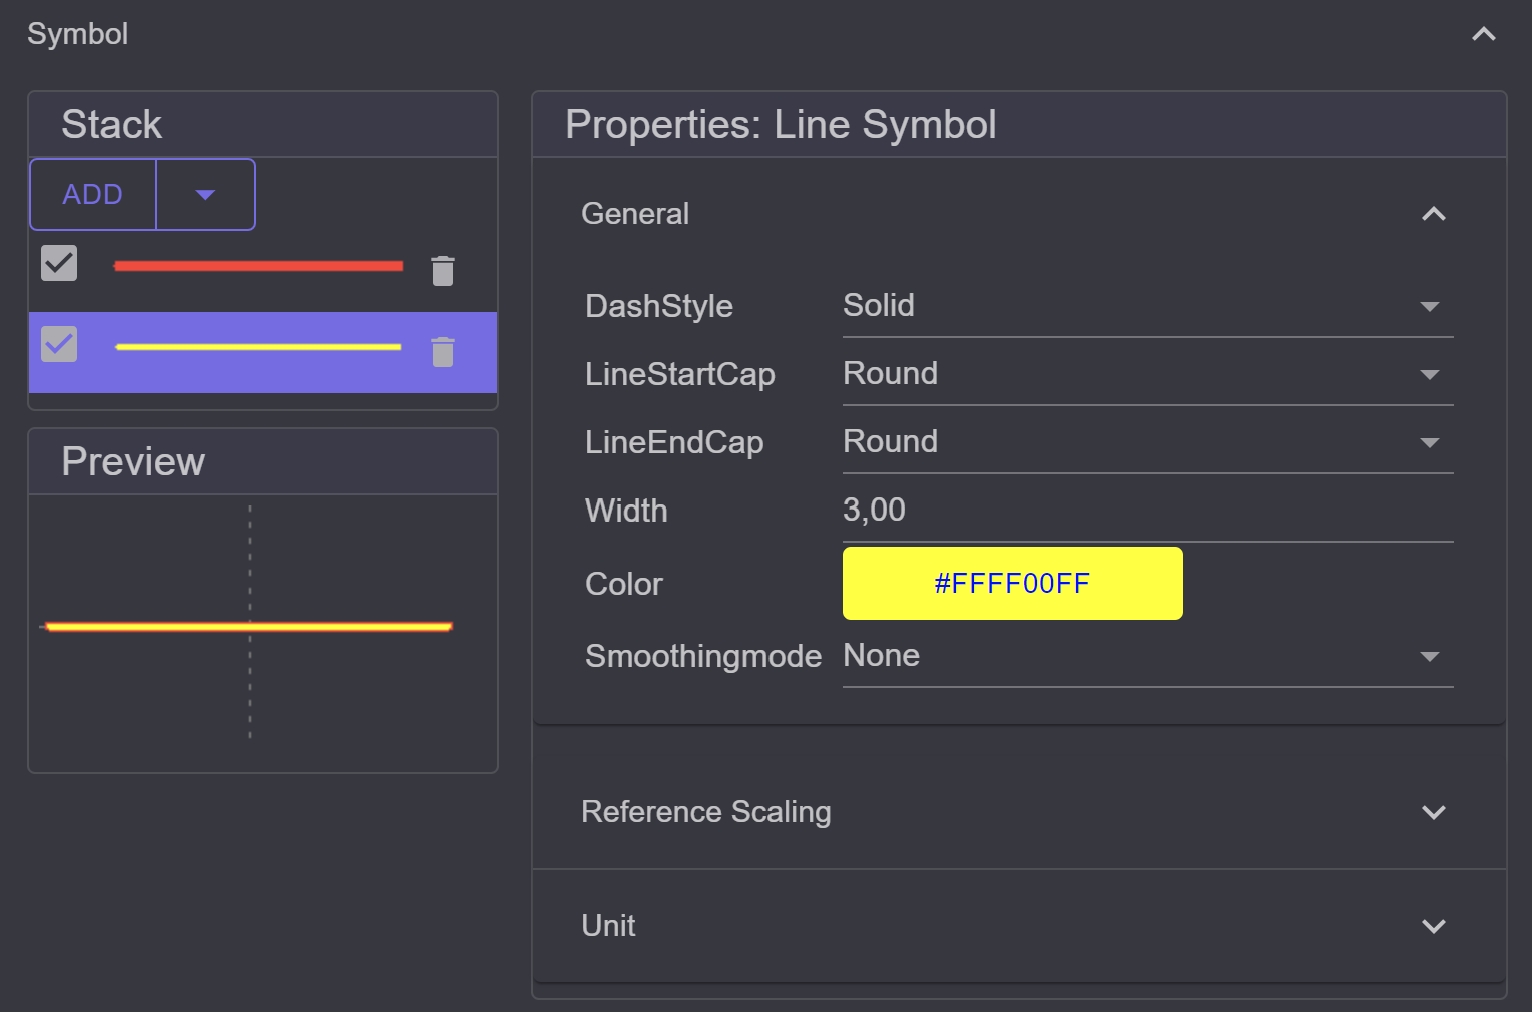
In the next step, add a new layer of the type Simple Line Symbol via the Add menu
in the Stack section. A new line appears in the stack. To edit the properties of a
symbol layer, it must be selected by clicking in the Stack. For the new line, set the
color to yellow and the line thickness to 3:
Note
The drawing order of symbols occurs in the Stack from top to bottom. The first (topmost)
layer is drawn first. The order of the layers can be changed by dragging with
the left mouse button.
Individual symbol layers can be removed using the trash can icon.
We can now close the dialog with Apply. If the symbol mask in the TOC is open afterwards,
it can be confirmed with Done. The symbol representation on the map
should now look like this:
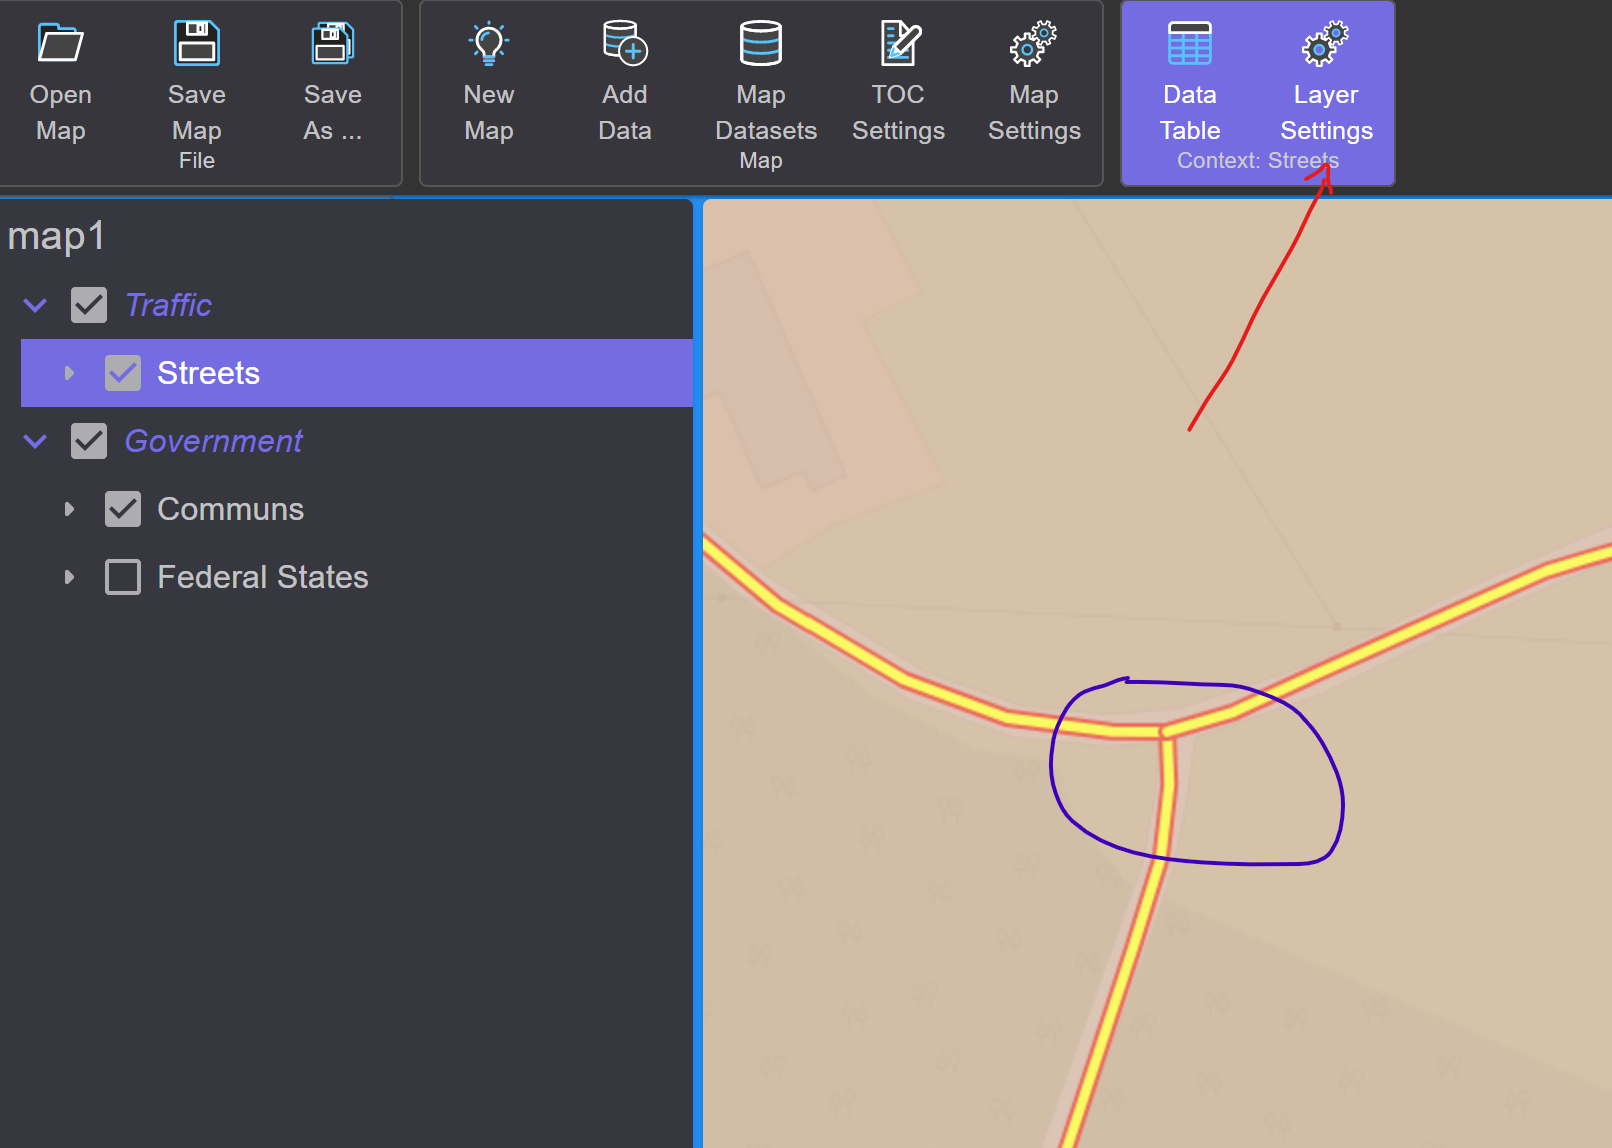
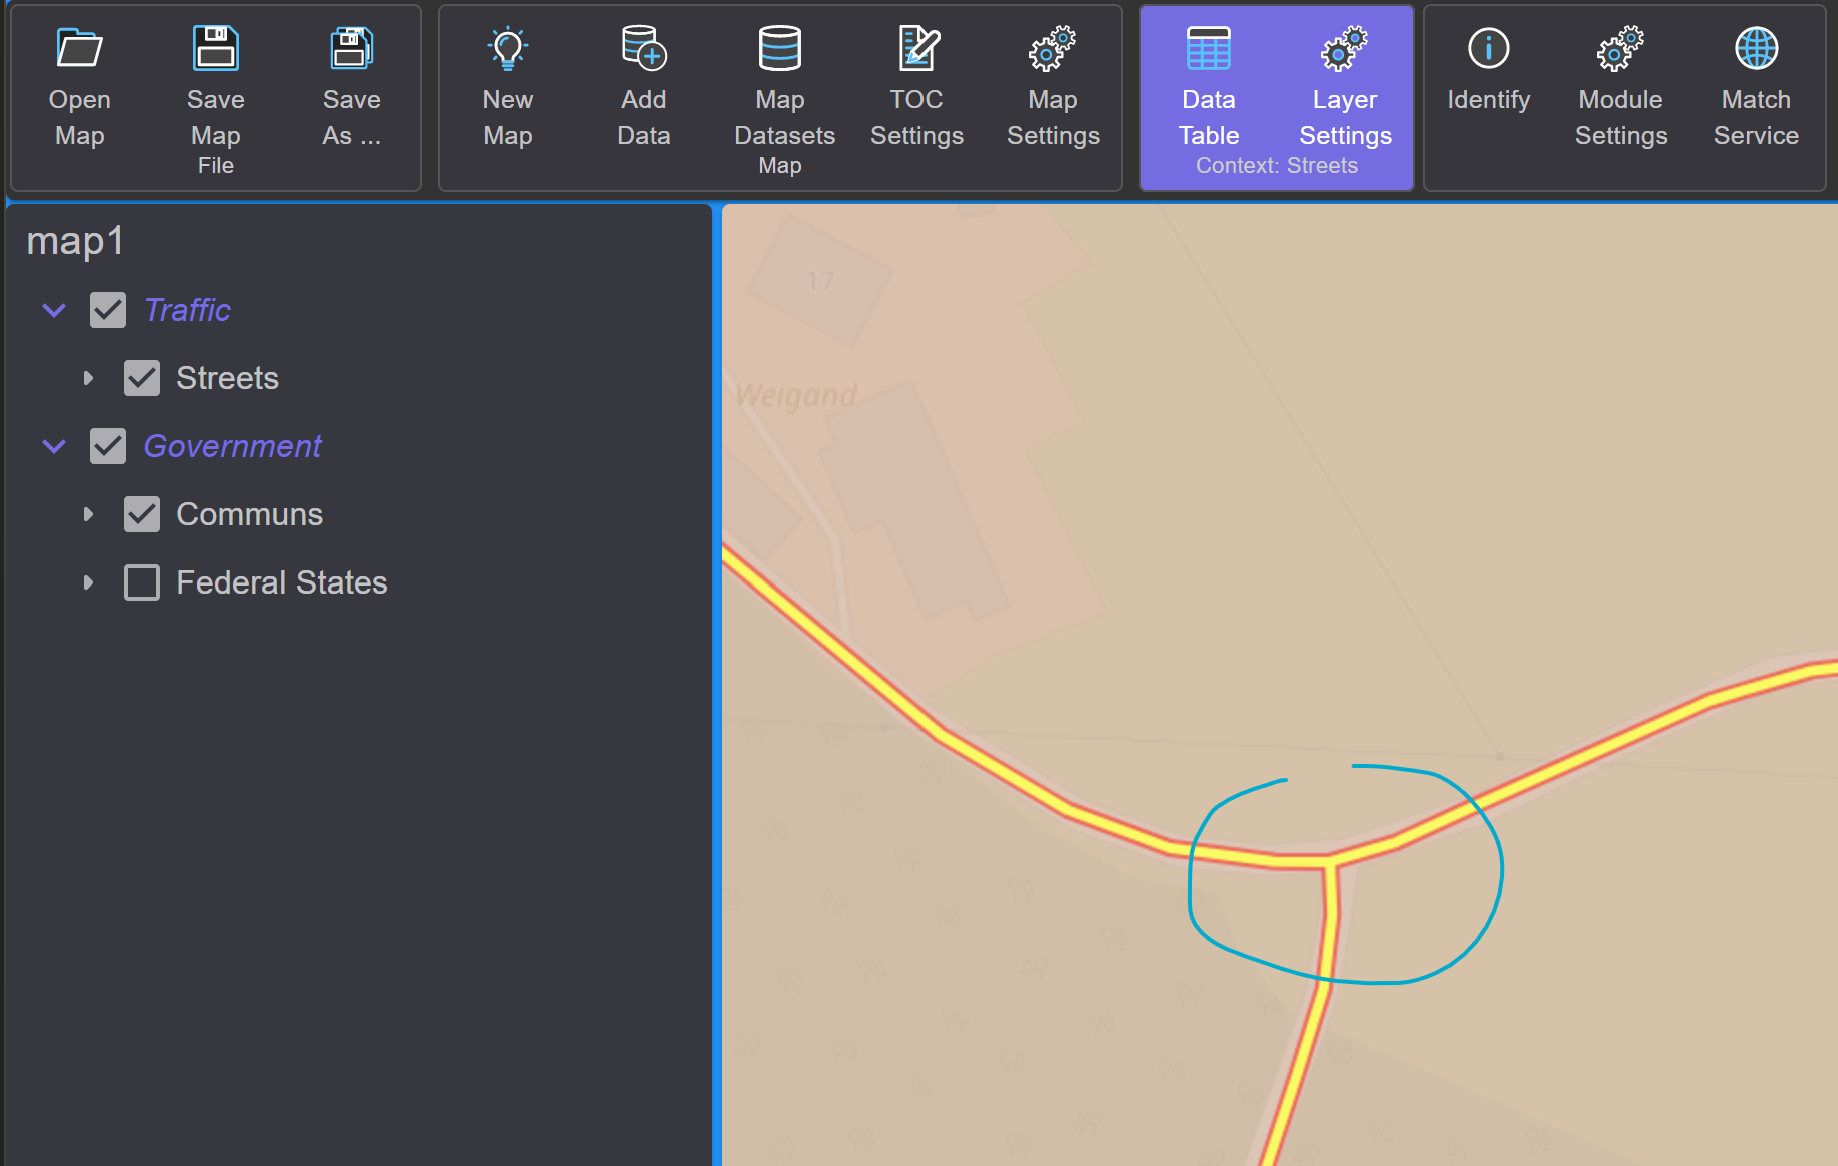
In the intersection area of the road, you can see that the representation is not yet perfect. The reason is that the individual objects are drawn one after another. Each object is considered separately, and both symbol layers are drawn for each object.
The behavior can be modified through the properties of the Renderer. A Renderer determines which methods are applied when drawing objects. To change the properties of the Renderer, the layer must be selected in the TOC. In the toolbar, tools highlighted in color appear, relating to the selected layer (see image above).
The render properties can be found under the Layer Settings tool. In the Layer Settings
dialog, switch to Feature Renderer on the left:
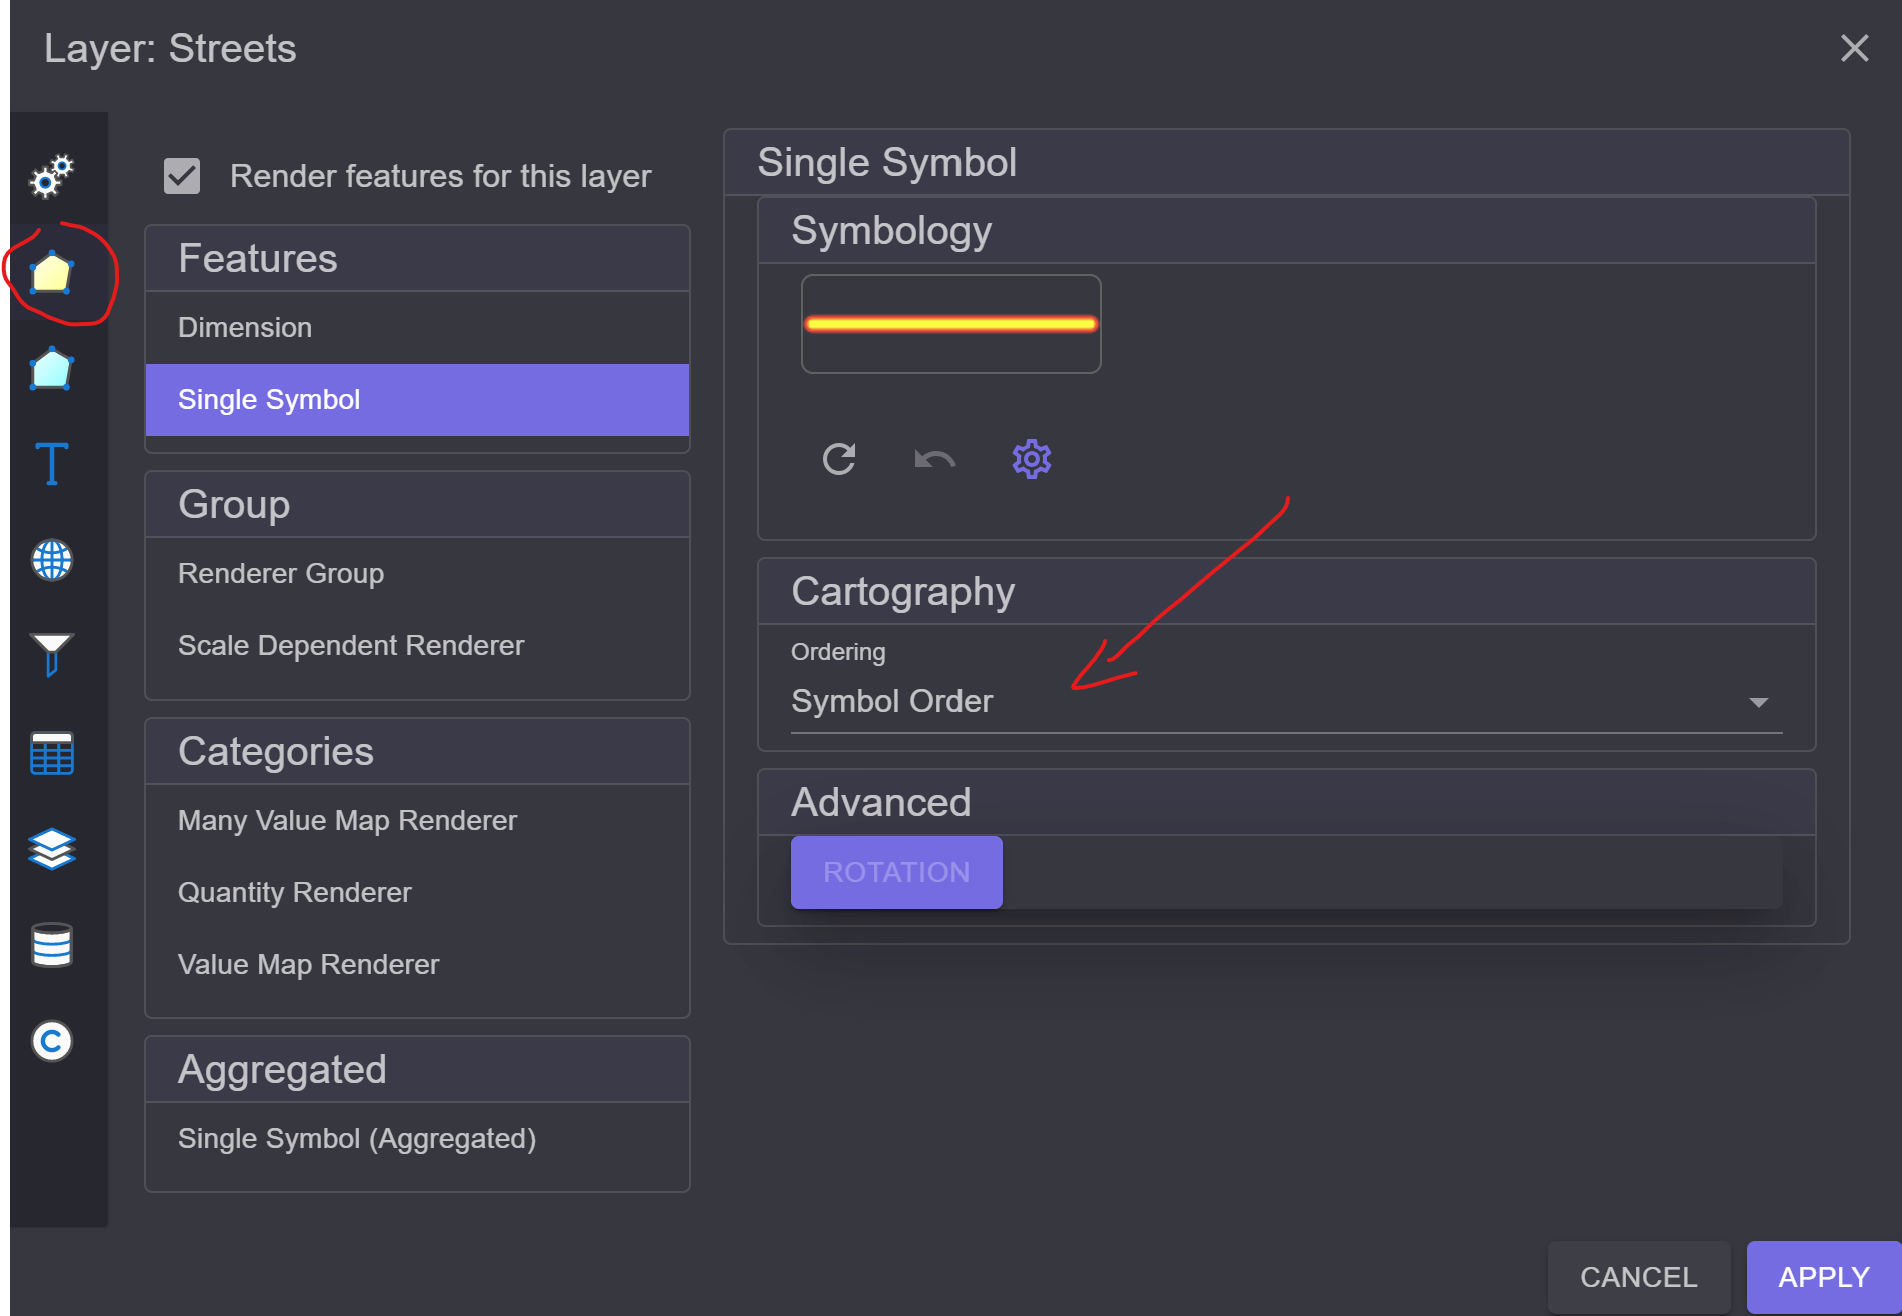
There are different types of Renderers, and for this requirement, Single Symbol is selected.
This can initially be left as is. Single Symbol means that the same symbol (which
can consist of several layers) will be used for all objects in the layer.
Important here is the Cartography/Ordering property. This property determines how the
individual symbol layers are drawn:
Simple: Each object is considered and drawn individually. All symbol layers are drawn at once.Symbol Order: The objects are drawn layer by layer. First, all objects are drawn with just the first symbol layer. Then, all objects are drawn again with the second symbol layer, and so on.
If you select Symbol Order and confirm the dialog with Apply, the result will look like this:
Note
The symbology of a layer can also be changed via the Layer Settings dialog.
In the Feature Renderer section, symbols are displayed depending on the Renderer.
Here, either the most important properties of the symbols can be set, as in the TOC symbol mask,
or the Symbol Composer can be opened.