Feature Renderer
Renderers dictate how layers are drawn on the map. This is not about the symbolism but about the logic of the display:
Simple: Every object (feature) has the same symbol.
Categorized: Objects (features) are divided into categories. This can be done based on attribute values or ranges of values.
Renderer Groups: Renderers can even be grouped/combined. For example, a layer can be drawn differently in different scale ranges.
To set the Renderer, select the layer in the TOC and open the dialog via the context-sensitive tool
Layer Settings. There, switch (on the left) to the section
Feature Renderer:
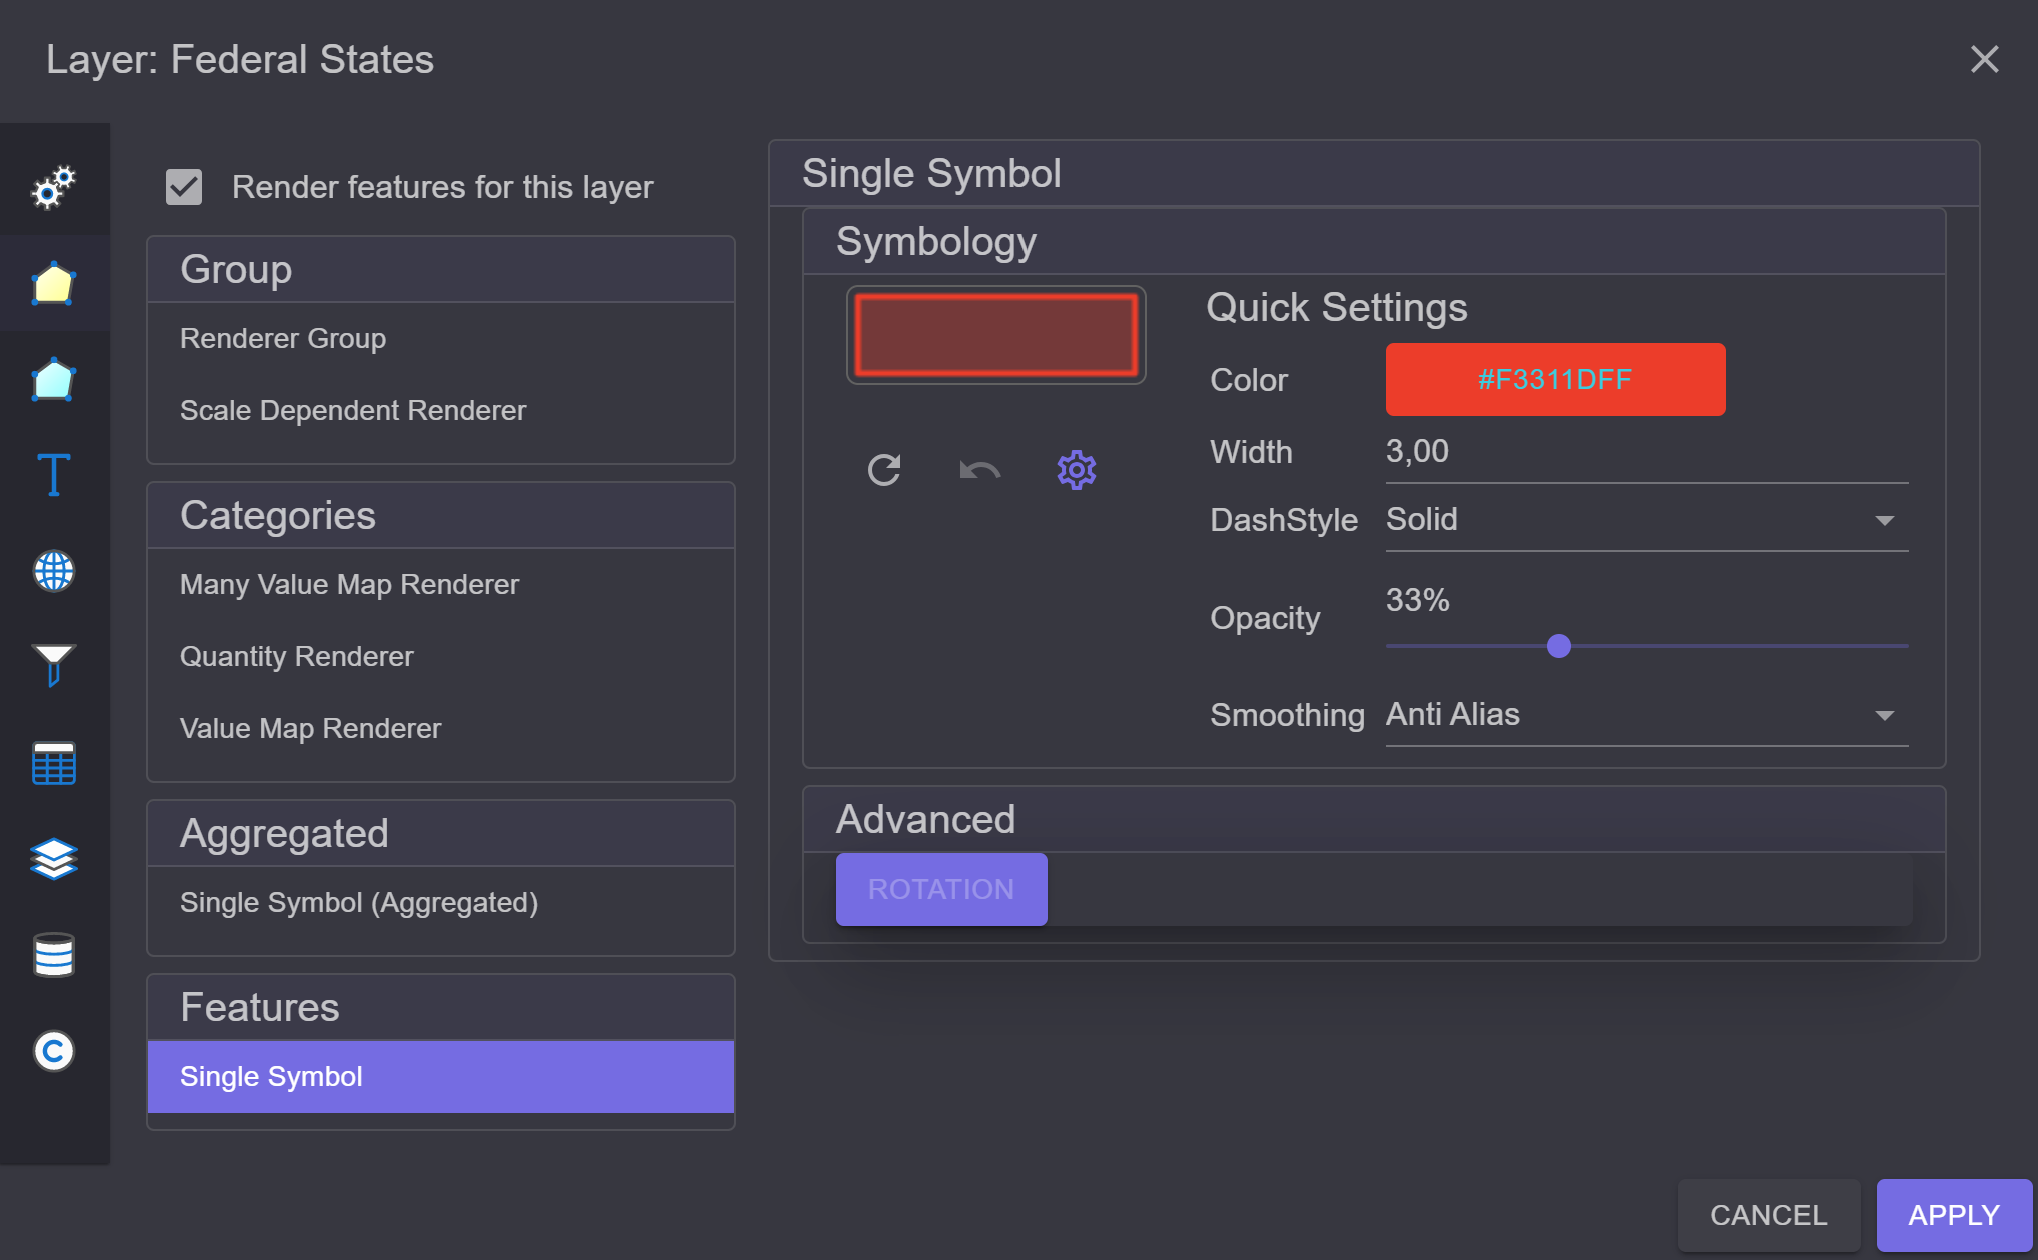
Simple Renderer
In this example, the Simple Renderer is preset. It assumes that the same symbolism is used for each
Feature. The corresponding symbol can be edited in the right area of the dialog.
Simple Renderer (Aggregated)
Similar to the Simple Renderer. However, here the features are not immediately drawn but are first
collected internally in a GeometryAggregate and then rendered.
This renderer has an experimental character. The Simple Renderer is preferred.
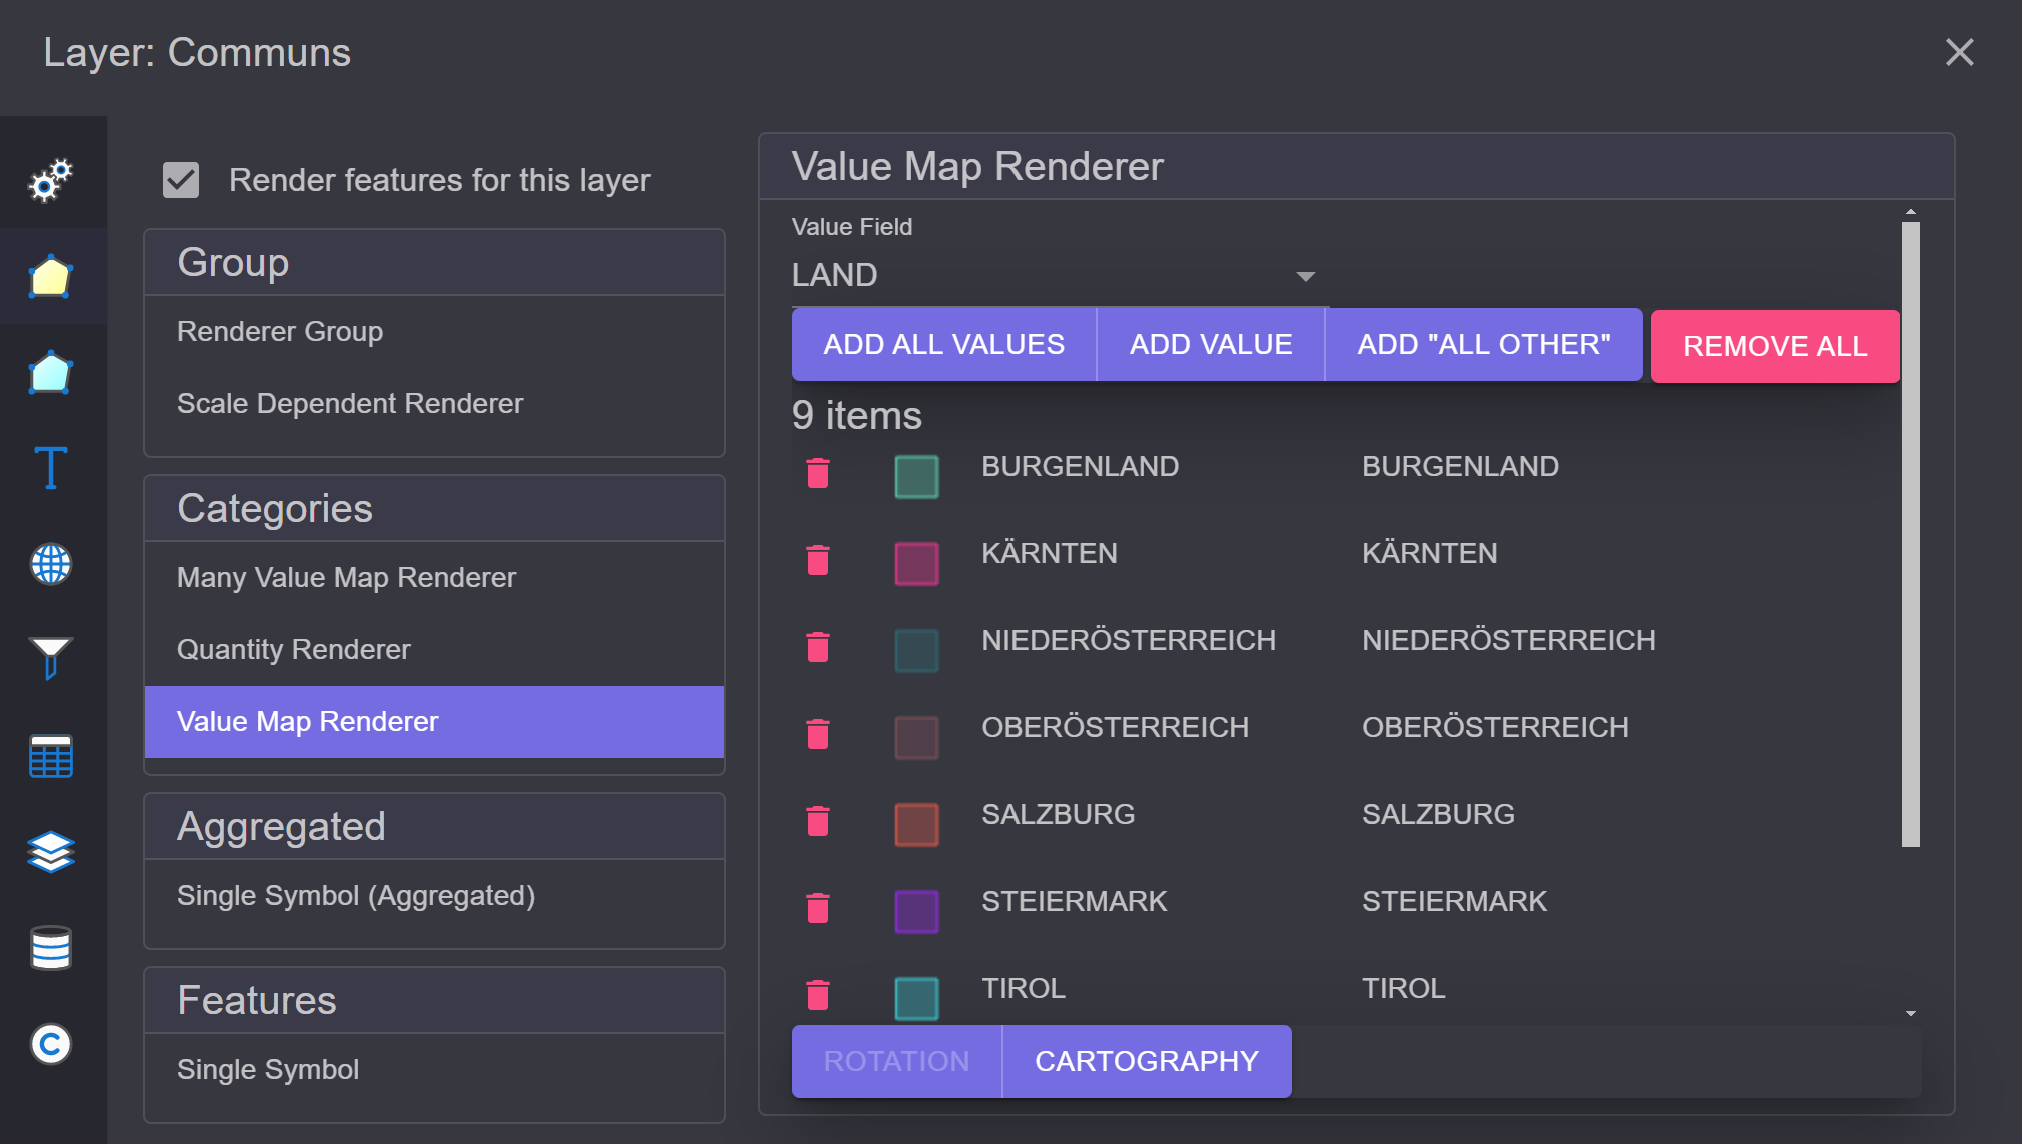
Value Map Renderer
Another often-used renderer is the Value Map Renderer. This renderer categorizes features
based on attribute values. An attribute of the layer can be defined for this purpose.
Features with the same attribute value are displayed with the same symbol.
In the dialog (on the right), first select the attribute. Then, using the buttons below the field selection, there are several options to define categories:
Add all values: Reads all possible categories from the layer and creates a random symbol for each category.
Add value: Manually sets a category.
Add “All Other”: Adds an
All Othercategory. This allows assigning a symbol for all features that do not fall into any of the listed categories. Without this category, these features would not be drawn.Remove All: Removes all categories.
An example would be to display all municipalities differently based on the state they are in.
Simply select LAND (=STATE) as the field and click on
Add all values:
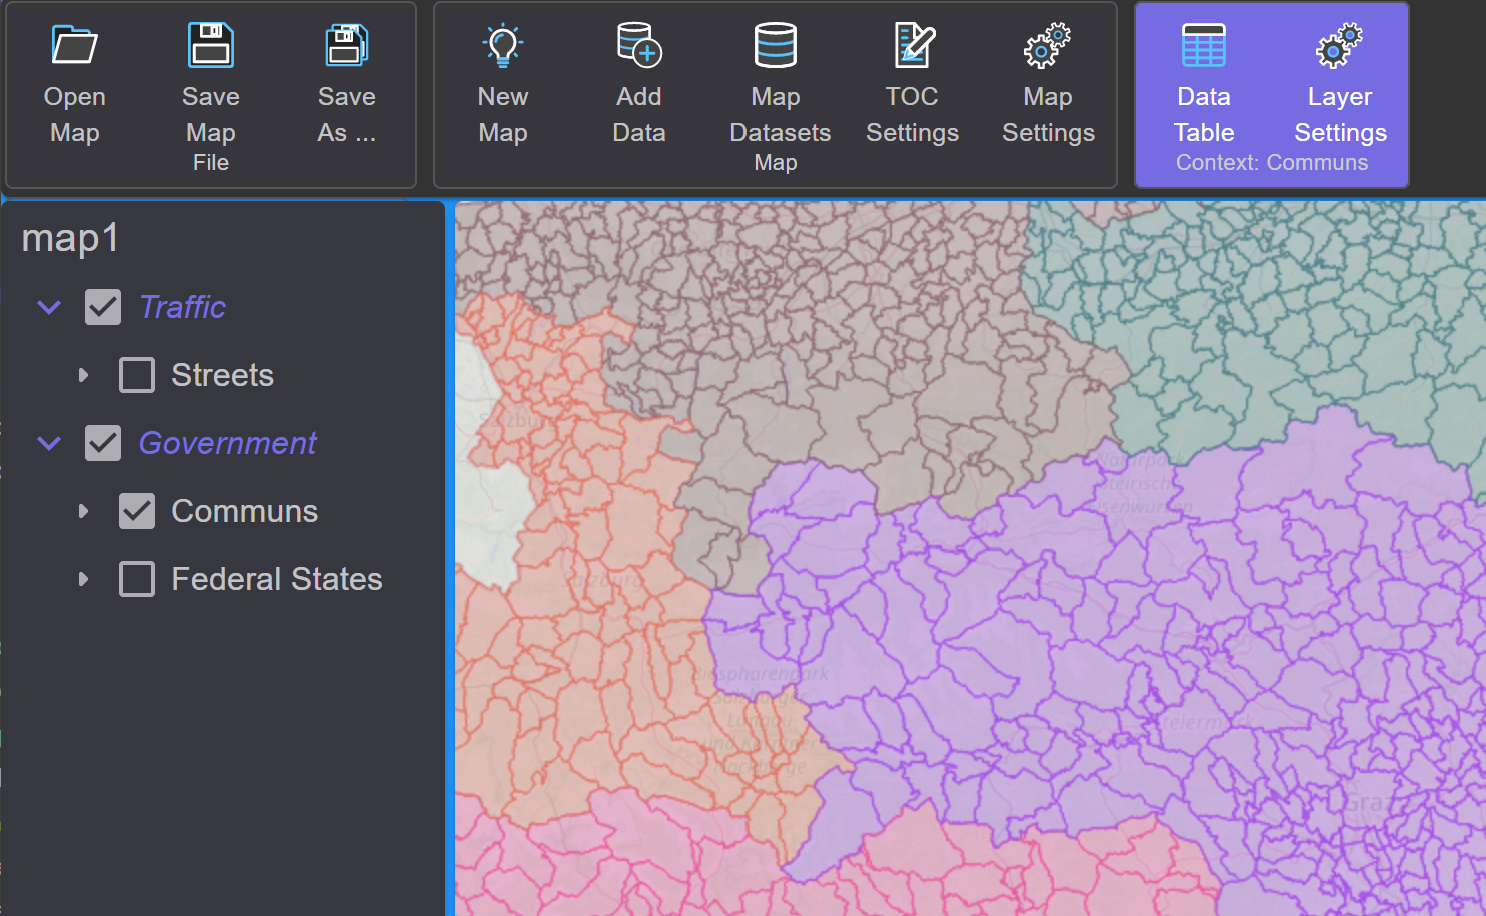
On the map, the result would look something like this:
To change a symbol in the Renderer dialog, simply click on the symbol in the corresponding category. This will display the Symbol Mask. From there, it is possible to open the Symbol Composer again. A single category can be deleted with the trash can symbol.
At the bottom of the list, there are additional buttons:
Rotation: This setting is only possible for point themes. Here, it can be specified whether the symbols should be rotated based on an attribute value. This button is also offered with the
Simple Rendererif the layer is a point theme. The rotation is only applied if aField Nameis specified: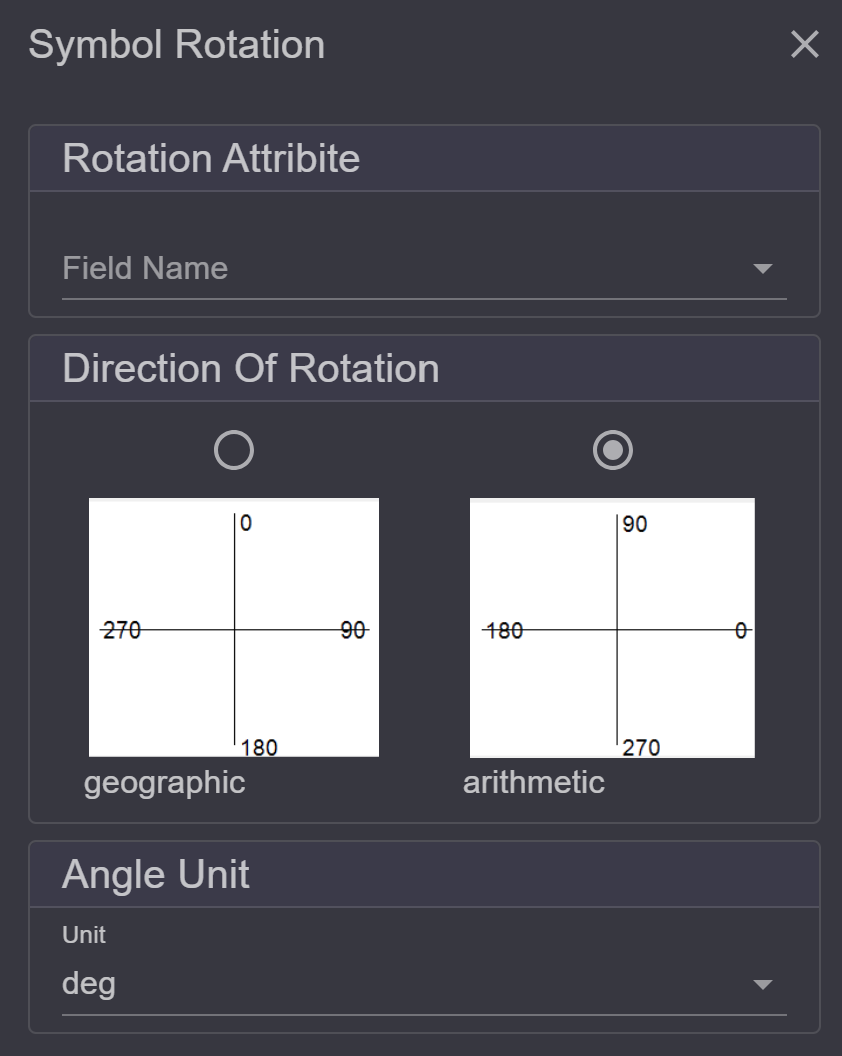
Cartography: Here, it can be more precisely determined in which order the features should be drawn.
Simpledraws the features in the order they come from the database.Legend Orderingdraws the features based on the legend, meaning each category is drawn separately. This can ensure that superior features are always drawn over subordinate features (highways over country roads).Legend And Symbol Orderingadditionally considers the individual symbol layers (Symbol Stack from the Symbol Composer):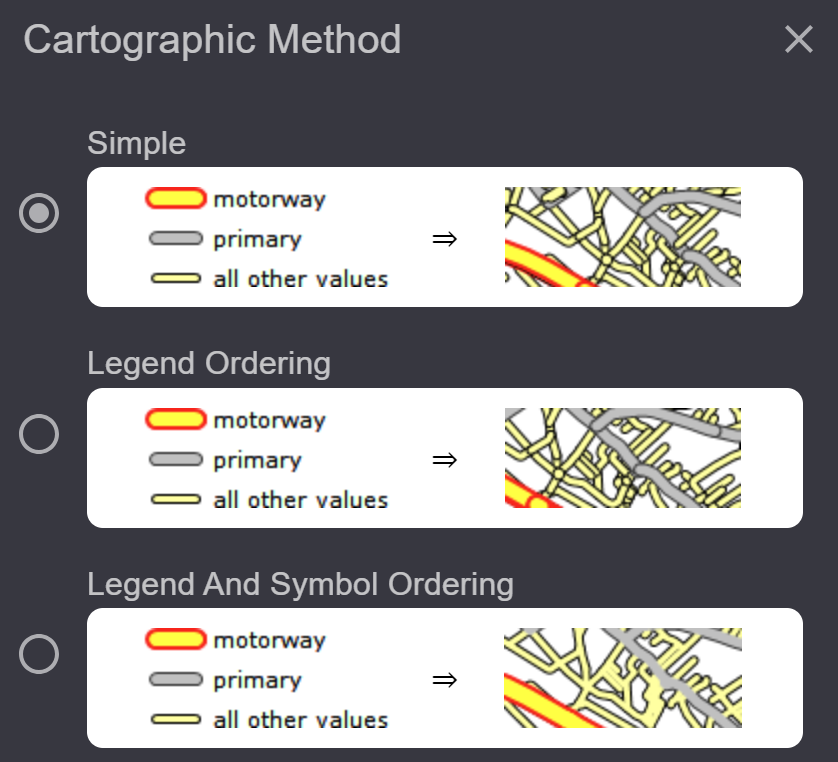
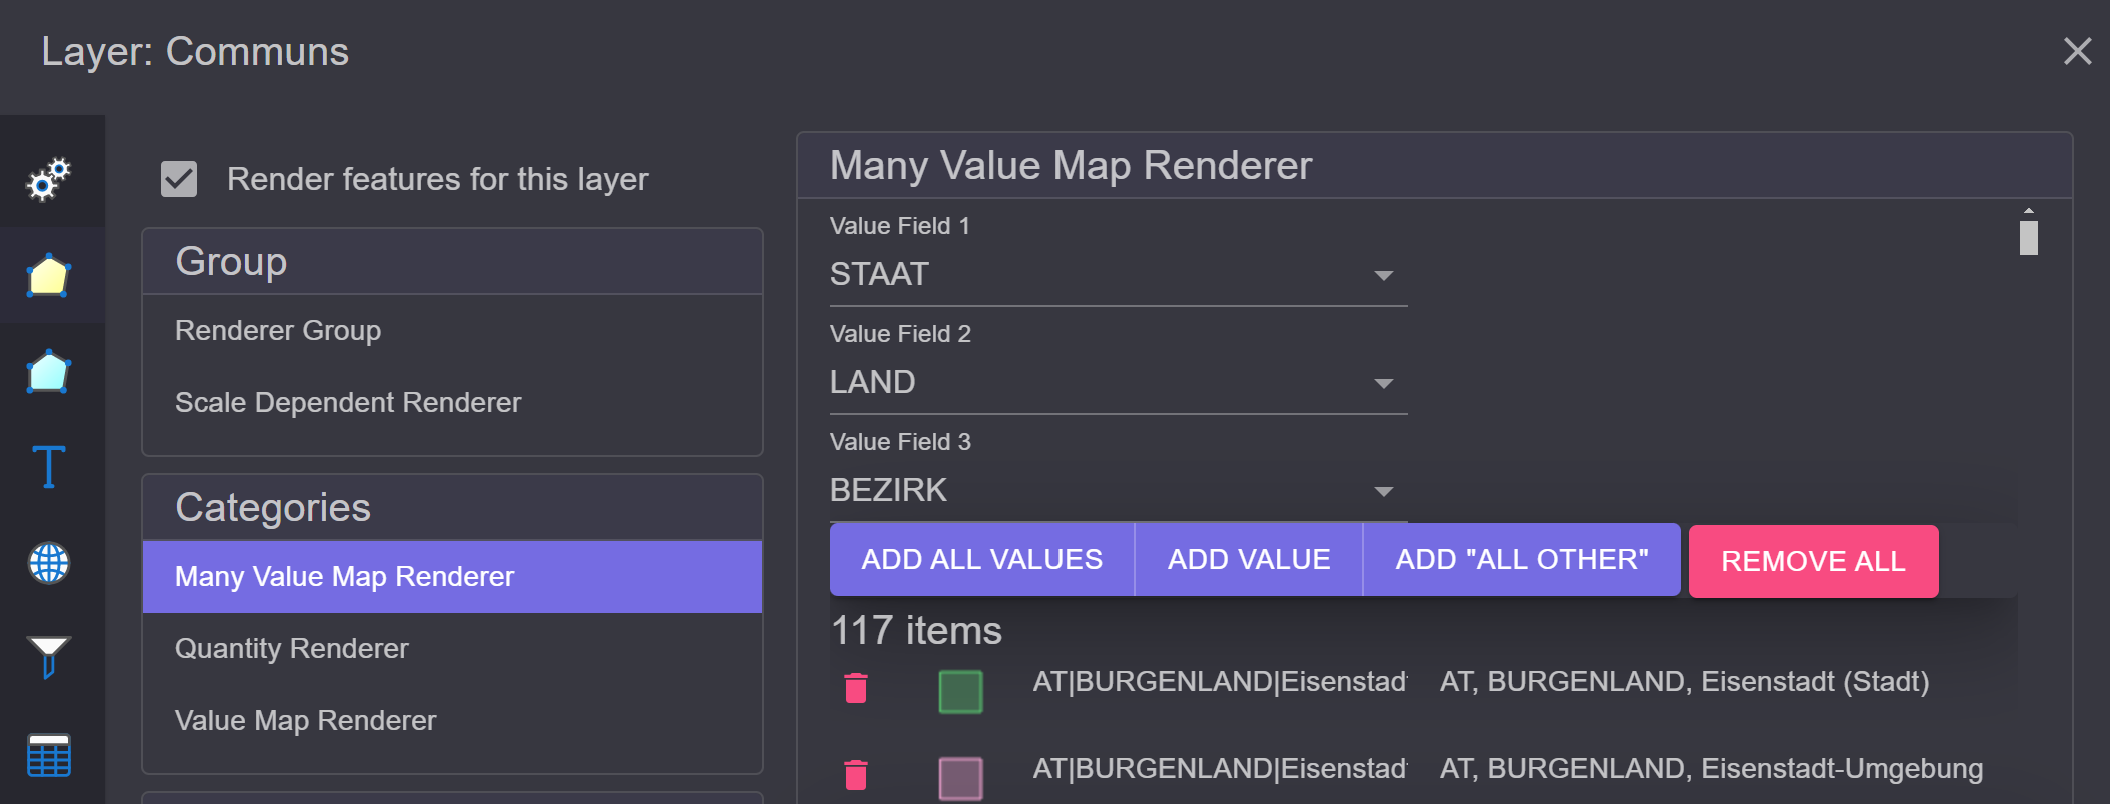
Many Value Map Renderer
This renderer is similar to the Value Map Renderer. However, up to three fields can be specified here that determine the category:
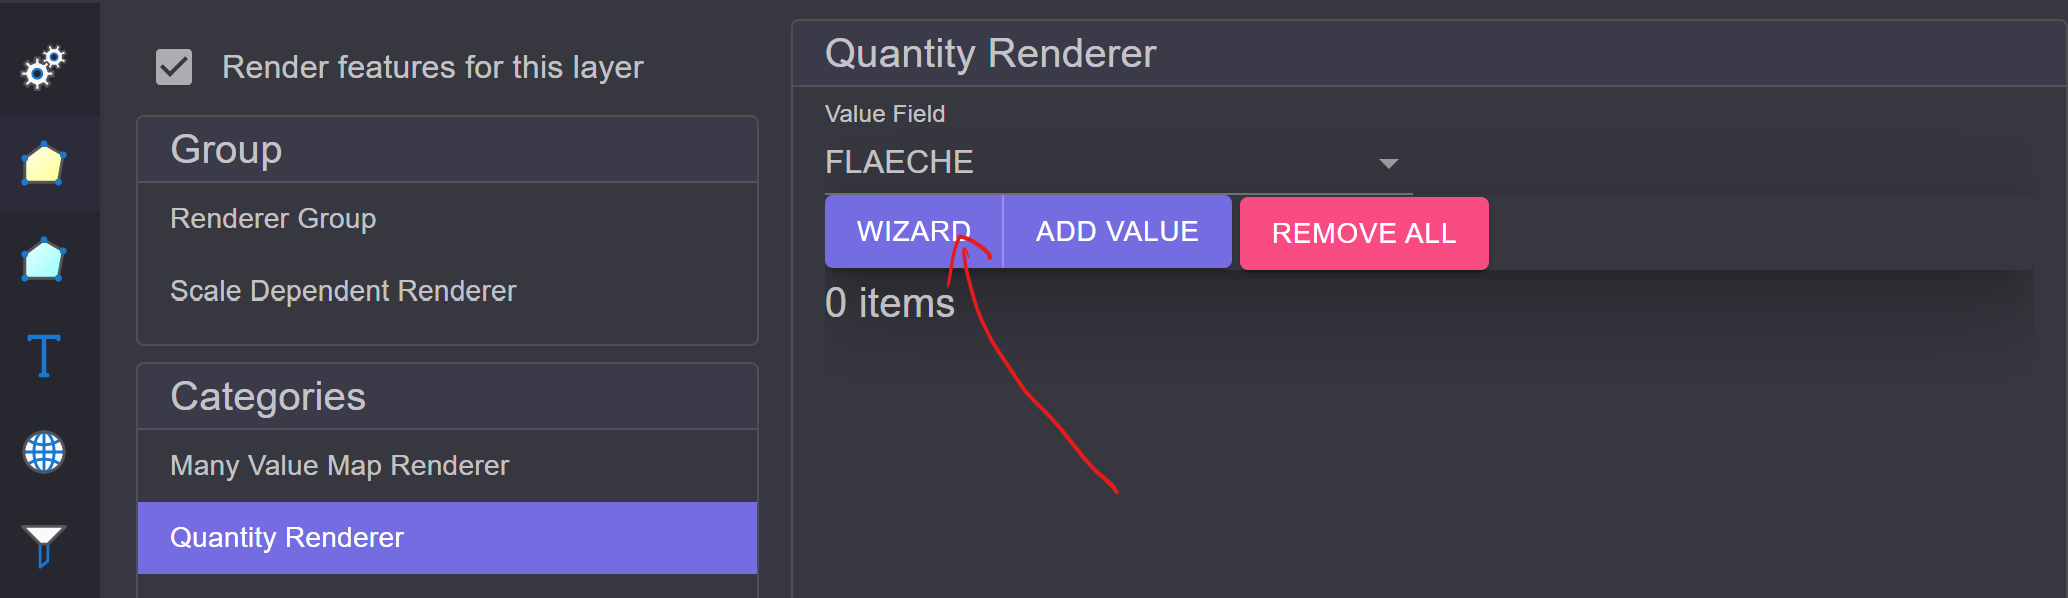
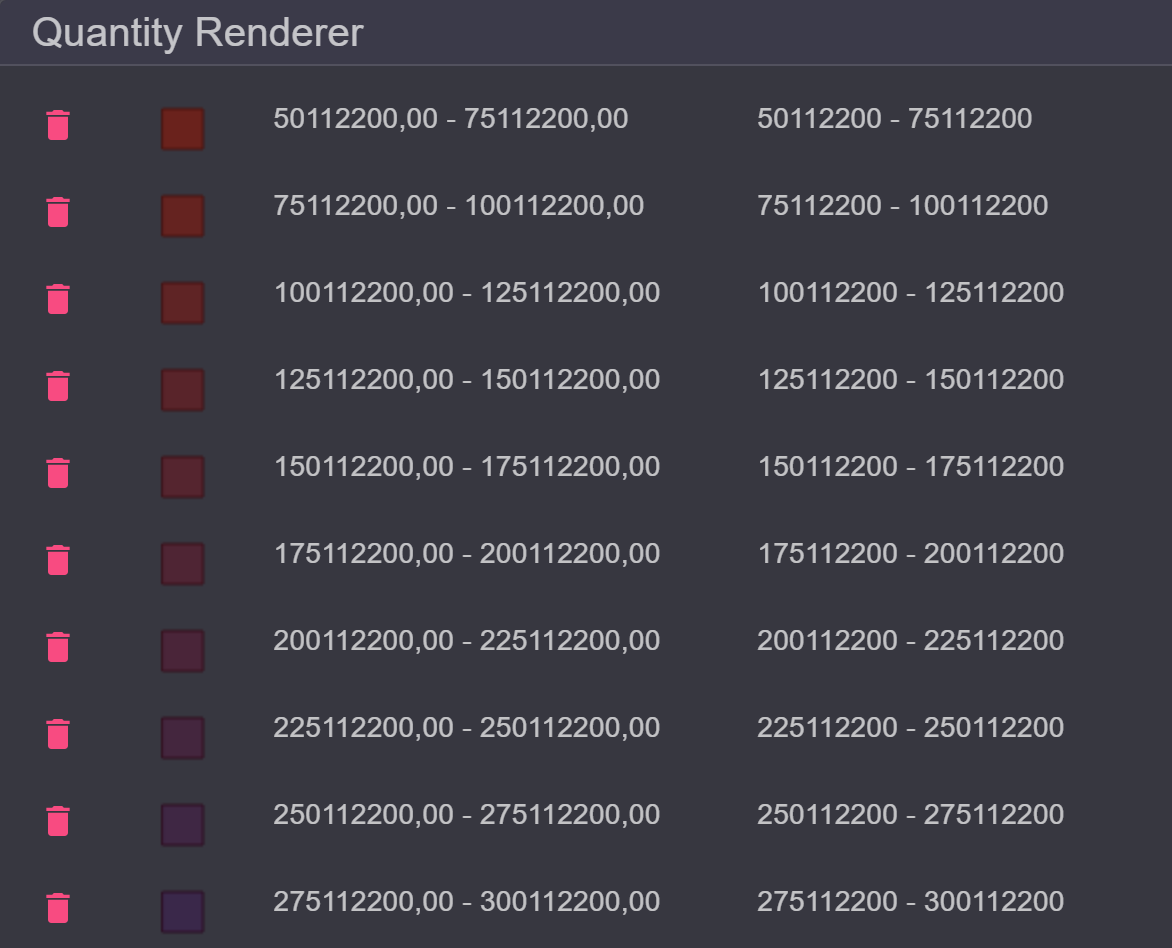
Quantity Renderer
With this renderer, features are categorized based on numerical value ranges,
for example, based on area. An easy way to define the categories
is provided by the Wizard:
The Wizard determines the maximum and minimum of the value range and assigns random symbols for these. These values and symbols can still be manually changed here. For the intermediate steps, a fixed step width or a fixed number of steps can be chosen.
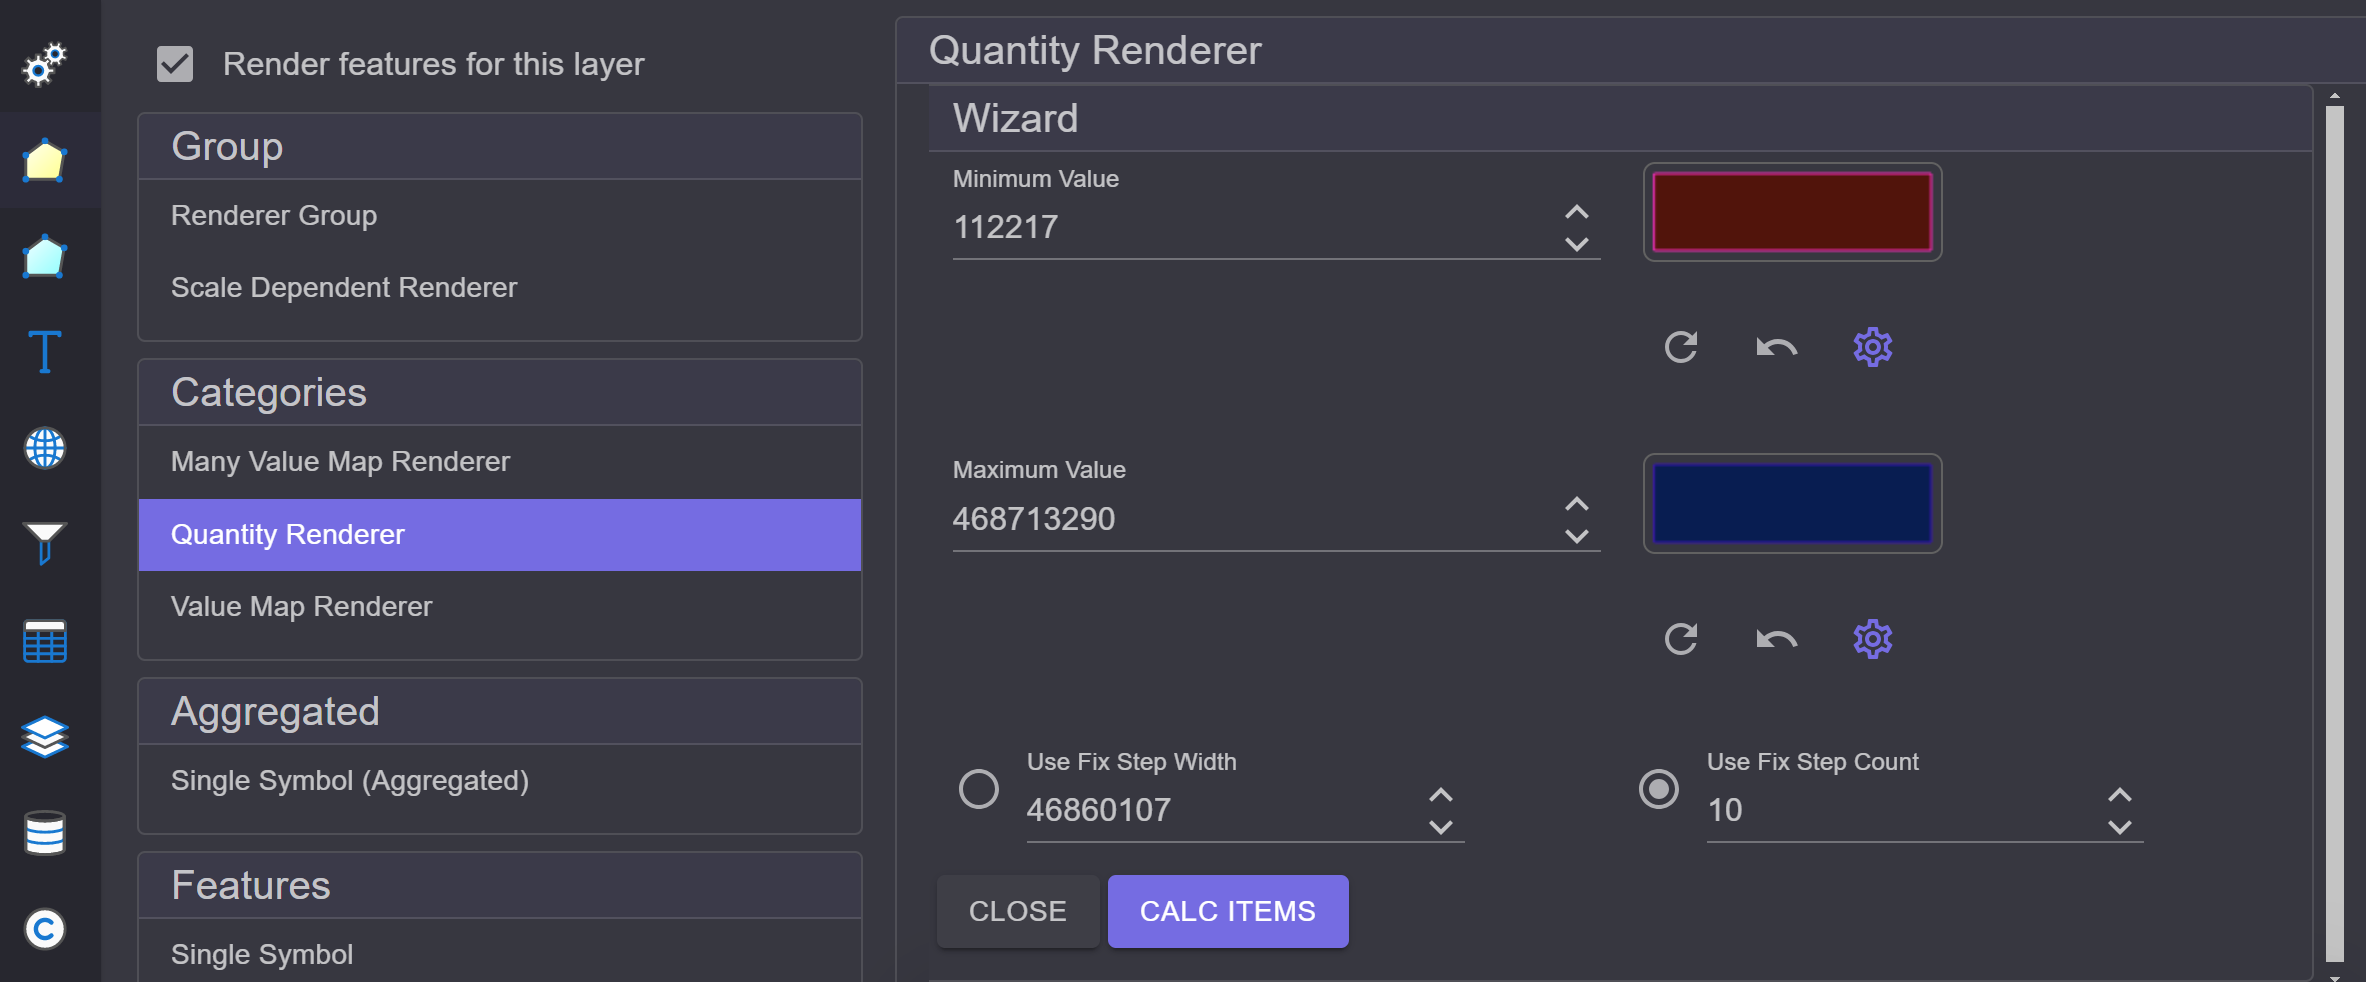
When you click on Calc, the intermediate steps are calculated and displayed below. If
the categories do not meet expectations, this step can be repeated until
the result is correct. Afterward, the Wizard can be closed with Close.
The Wizard also attempts to create a smooth transition between the starting and ending symbols:
Scale Dependent Renderer
This is a Renderer group. Here, multiple Renderers can be defined,
each applied within specified scale limits.
Renderers can be added via the Add menu:
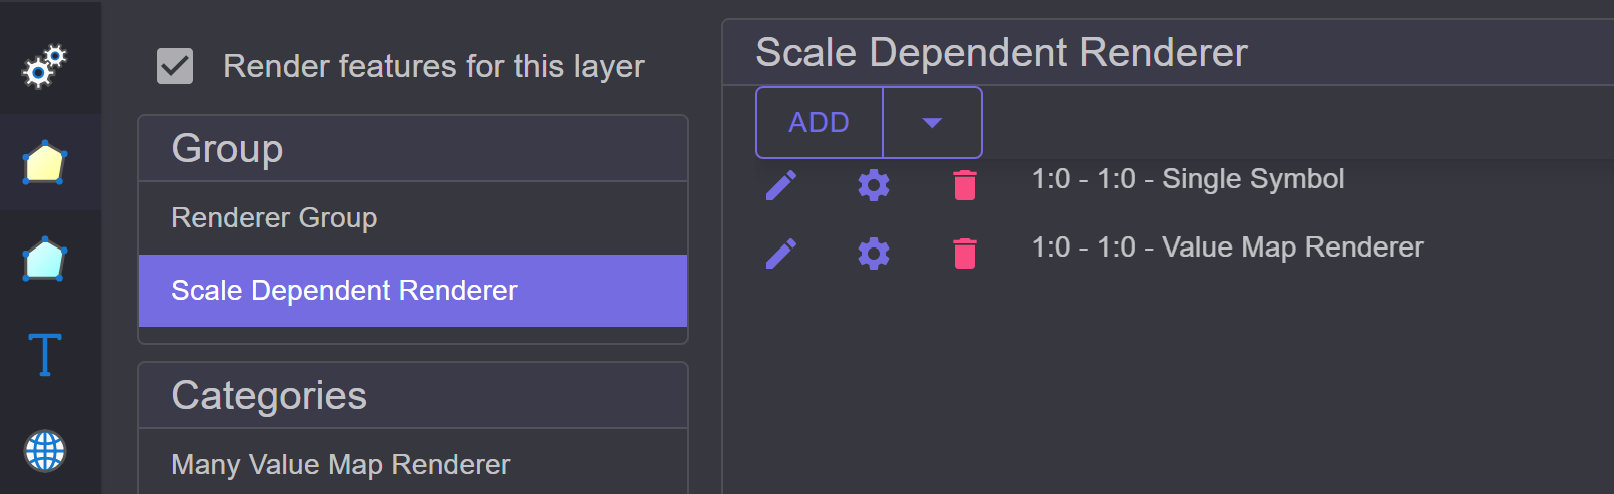
Each row corresponds to a renderer. The order can be changed by dragging with the left mouse button.
The corresponding renderer can be edited via the Edit icon (pencil). A renderer can be removed from the list
using the Delete icon (trash can).
Further settings can be made via the Settings icon (gear). These include the scale limits
within which the Renderer should be applied:
Group Renderer
In principle, this corresponds to the Scale Dependent Renderer but without scale limits.